Why is there no Bitcoin bubble in 2025?
Log-periodic timing, not linear periodic

This is not investment advice for either gold or Bitcoin
Linear presumption upset
The largest bubbles in Bitcoin’s history have been in 2011, 2013, 2017, and 2021. Despite the expectations of many Bitcoiners who are convinced of a four year cycle, there has been no bubble in 2025.
Why? Because people have been drawn into a narrative of bubbles occurring in linear time on four year cycles, with peaks expected to follow the four halving years in 2012, 2016, 2020, and 2024. This narrative was further reinforced by appeals to the business cycle and the presidential election years in the US.
I’ve been there myself with the four year linear cycle presumption.
In the past year I have been doing more and more modeling of the bubbles and separating the analysis of the core power law zone and the bubble zone.

What became clearer was the fall in the bubble energy, roughly as the reciprocal of the age of Bitcoin, or with a power law to the -0.83 power.

People have also been incorrectly assuming bubbles would be as large in percentage terms, the bubble strength has clearly been decaying. The indication with the research presented in this article is that they are stretching out in temporal spacing as well.
But what about 2011? It has become routine to ignore the 2011 bubble as an early out-of-cycle occurrence. However, that large bubble of 2011, was just as significant as the ones in 2013, and 2017. It deserves the same respect as the following two. What if the bubbles are occurring not with a linear periodicity but with a periodicity in log time? This is called log periodic behavior.
Log periodic bubbles result from power law
After all, Bitcoin is a power law asset, which means its behavior with time is scale invariant. In order to have the same ratio in price increase one has to have a ratio of time increase. For example, if the relation of Price ~ Age^k, then if k = 5.7 in dollar terms, when the age doubles, the price increases by a factor of 52. To achieve that same increase of 52 times in price requires the age of Bitcoin to increase from 2 years to 4, then 4 years to 8, then 8 years to 16, etc.
So it would be quite natural that the bubble occurrences would be spaced out further and further in time. And one might expect one major bubble per such logarithmic interval. The bubble separation would grow in linear time.
In fact, in 2019 Giovanni Santostasi, who had discovered the power law nature of Bitcoin prior to the second halving, proposed a log periodic approach around the power law trend for the overall behavior. It is the curved or oscillating line in his log price - log time plot below (Figure 1). A general correspondence is seen with the 2011, 2013, and 2017 bubbles. It even suggests a future bubble peak around x = 3.817, which is the log10 of age corresponding to 6561 days or 17.96 years, call it 18 years, around the very end of 2026 or the start of 2027.
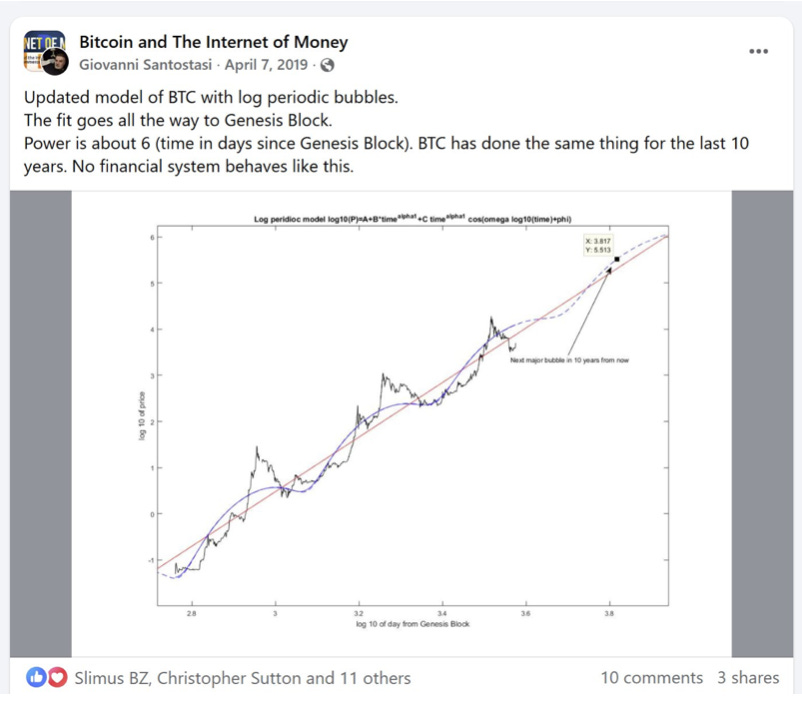
This post six years ago should have received more likes; although the amplitudes are subpar the timing match is good and as we shall see the projected fourth peak may turn out to be rather accurate.
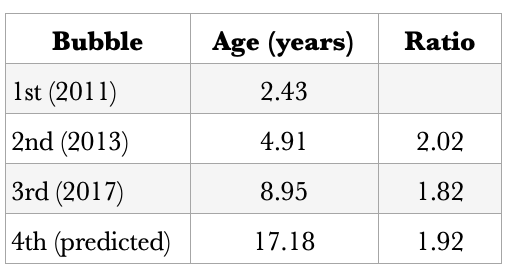
Somewhat crudely, one can look at age ratios. The first two pairs of adjacent major bubbles are separated by ratios of 2.02 and 1.82, if one averages the ratio to the fourth bubble would be 1.92 and the occurrence around age 17.18, early 2026. Again, this is a crude first guess.
Two things to note here: there is no prediction of a 2021 bubble nor is there a prediction for a 2025 bubble in Giovanni’s fit or the one that I have run with 6-1/2 years of additional data. This raises the question of whether the 2021 double bubble, which was a little sloppy, was a fundamental one or not.
Full log periodic analysis
The next thing to note is that the full log periodic algorithm is more precise than using just two intervals between peaks.
It is related to a more complex log periodic analysis popularized by geophysicist Didier Sornette for earthquakes, other natural phenomena, and financial series. That full equation has seven parameters including a local power law index and a harmonic (cosine) term with a log temporal dependency.
For the purposes of this article we look at Fourier and wavelet analysis in log time of the full price history. Measuring BTC in gold ounces, I have performed a scale invariance test that yields a power law index of 5.30 with R2 of 0.94 and standard deviation of 0.314 in the log10 price residuals.
The Fourier transform analysis in log time of the collapsed residuals (after removing the 5.30 index power law) results in a log periodic characteristic wavelength parameter λ = 2.07. In the peak interval formulation above this is roughly related to the ratio of age between bubbles, but it is a more global estimate and considers harmonics as well. A wavelet analysis found that λ is in the range of 2.00 to 2.10.
The determined best fit λ value corresponds to the fundamental mode and it fits the 2011, 2013, and 2017 bubbles. It also projects the first fundamental bubble after 2017 to occur at age 18.4, which is in late May 2027. If we instead were to use λ of 2.0 from the lower end of the wavelet analysis, we would project 17.9 for the age, a year from now, and quite close to Giovanni’s 2019 projection.
“The discrete age-ratio model and your LPPL fit are describing the same underlying discrete scale invariance (λ ≈ 2), just in different coordinates; once you account for ln(t_c − t) vs age t, noise, and half-harmonics, they’re fully consistent with a 4th fundamental bubble sometime around 2026–2027, with LPPL biasing a bit later (≈2027) and the crude age-ratio method a bit earlier (≈2026).” - GPT5
What was the 2021 bubble, then?
What about 2021? In this framework that is not a fundamental mode, rather the first harmonic of the fundamental (higher frequency but shorter wavelength since angular frequency for the log periodic behavior is λ = e^{2 π /ω} in the LPPL model). That corresponds to a ratio equal to the square root of 2.07, which is 1.44. Multiplying by 8.95 yields age 12.89, or late 2021, corresponding quite well to the actual age of 12.85 when the double bubble peaked.
What about 2025? No bubble is predicted with a log-periodic sequence. Bitcoin underperforming gold this year was indeed the expectation for this framework.
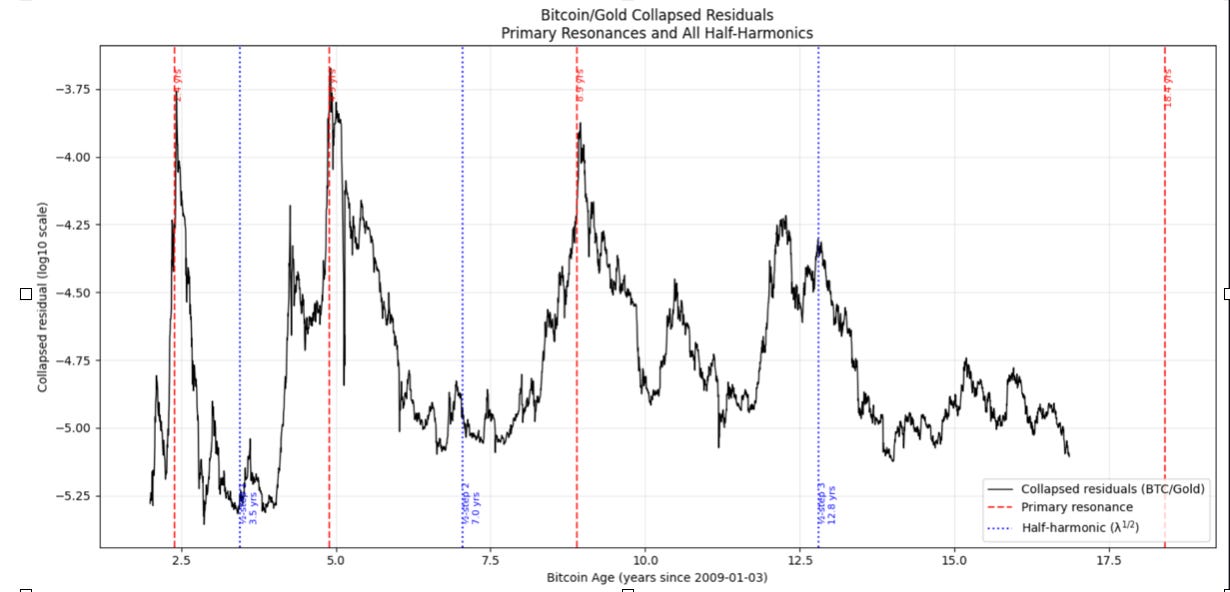
The full mapping of the fundamental and half-harmonic (first harmonic in frequency, called half-harmonic in wavelength terms) modes is shown in Figure 2. The red vertical lines are the fundamental mode bubble peaks, the blue lines are the half- harmonics. The three red lines match very nicely, not hard to do but the blue lines also reflect smaller bubbles of this harmonic pretty well. This is not a full mapping, there are higher harmonics that contribute to a lesser degree.
The fourth red line is the age of 18.4 years prediction for the next major Bitcoin vs. gold bubble. Perhaps Bitcoin can climb in gold terms starting early in 2026 and peak by the second quarter of 2027.
Why this behavior? Continuous scale invariance and discrete scale invariance.
Understanding Bitcoin’s price behavior requires understanding both continuous scale invariance and discrete scale invariance. The continuous type is the ongoing long-term power law that readers are generally familiar with. The discrete scale invariance corresponds to the intermittent bubbles and can be modeled with LPPL. There can be some confusion because of the log periodic power law name.
LPPL is intended for shorter to intermediate scales of financial series, and in this case it is meant to model the excursions away from the core power law trend. So one has two things going on simultaneously, the overall power law (continuous) punctuated by high volatility departures (discrete) which ride on top of the ongoing power law trend.
The power law rises long term in accordance with Metcalfe’s law of networks and the rate of adoption of Bitcoin.
The bubbles are due to adoption waves from new participants that have become interested as Bitcoin price pierces through new levels separated by orders of magnitude (Bitcoin’s price has gained over 7 orders of magnitude, 7 factors of ten, during its brief but impactful history).
Bitcoin is adopted when it can change your (institution’s) life
When Bitcoin was low in price it attracted mostly cypherpunk enthusiasts and retail trading and investment but over time it attracted higher and higher levels of institutional capital, first miners, and then exchanges, and then futures trading, followed by a few corporations, and now treasury companies, ETFs and other institutional vehicles. Institutional capital is the net buyer now, and one must remember that most of their holdings are custodial for large numbers of clients and shareholders.
As Bitcoin’s price and market cap become sufficiently high, pensions, sovereign wealth funds, and even national treasuries can be enticed to invest in Bitcoin. Each subsequent bubble occurs at a much higher price level in gold ounce terms (and even higher in fiat terms) than the prior bubble, and successively, whole new levels of capital are able to adopt Bitcoin in a significant way.
Even at $2 trillion market cap, Bitcoin remains too cheap to be of significance for the largest companies and for medium to large country treasuries. If they were able to buy 1 million coins at a cost of order $100 billion it would not “change their life”.
Bitcoin’s power law forces adoption waves by larger and larger players. It is emergent from the protocol that attracts hash power and strengthens the security, by the first mover advantage, and the Metcalfe network effects leading inevitably to a higher price.
And thus fiat capital is incentivized toward Bitcoin, and even fiat that might have gone to gold goes to Bitcoin instead. Yes 2025 has been relatively weak for Bitcoin in comparison to gold, but this was likely to be a trough year relative to gold based on the analysis above.
The waves of additional adoption by new players come in as LPPL bubbles which means they must crash around their local critical times. And thus trajectories return to the long term power law, a stable attractor represented by a restorative spring force as discussed in this physics GUT analogy article.

Since P ~ T^k for the power law, where k is the index and T the age, and its first derivative is δP / P ~ k/T the spacing of the bubbles is expected to be logarithmic. Relative growth slows as the reciprocal of Bitcoin age, but bubbles require δP / P >> k/T. A bubble is by definition when the price grows at a much higher rate than the long term power law trend.
That expression can be rewritten as δ (log P) ~ k * δ (logT) and thus it is expected that substantial price excursions in log terms (large multiplicative ratios) require longer and longer linear times, that is they require a proportional increase in log time that is of order the 1/k root of the required multiplicative excursion.
In fact, in gold terms the median peak for 2011, 2013, and 2017 bubbles, relative to the power law trend is a factor of 10.1 and the power law index is 5.31. One expects λ to be roughly 10.1^(1/5.31) =1.55, which is about 3/4 of the 2.07 found from the log-periodic fit to the peak timing. So empirically when measuring in gold terms λ ~ (4/3) F^(1/k) where F is the typical peak ratio to the power law trend price.
Summary
Bitcoin’s major price behavior is composed of:
continuous scale invariance expressed as a power law of about 5.3 index in gold terms and 5.7 index in dollar terms, and
Discrete scale invariance (DSI) reflected in intermittent bubble events as new tiers of greater capital are enabled to enter the system only after the price and market cap have reached a sufficient level to entice those capital tiers and the regulatory environment has allowed for it. Discrete scale invariant events can be modeled as LPPL bubbles and corresponding crashes.
The 2013 bubble was characterized by retail, early miners, early Bitcoin startups and the first-generation of exchanges. For the 2017 bubble hedge funds and family offices and other high net worth individuals had entered and GBTC trading had begun in 2015. The top happened as the CME futures were introduced in December 2017, which allowed for efficient shorting and hedging. The 2021 bubble had validation from some corporate treasuries and some small government participation. Because of the greater institutional participation and rails there was greater capacity to hedge and go short, to end the bubble and allow price to return in spring-like fashion to the power law trend.
The next large adoption wave centered around 2026 and 2027 perhaps will see Bitcoin approaching $5 trillion in market cap and became enticing to megacap corporates, sovereign wealth funds, and with increased government (state pensions and national treasuries) long-term accumulation. Bitcoin’s discrete bubbles mirror the tiers of global capital: from retail to funds to corporations to sovereigns, resulting in DSI behavior and declining volatility associated with deeper market cap and institutional behavior.
“Each tier is accessed only when Bitcoin is sufficiently large, liquid, and credible — which takes longer and longer due to its power law growth with k/t decay in returns.” - ChatGPT 5
The fundamental mode for DSI has a wavelength parameter λ = 2.07 for log time. This corresponds roughly to a doubling of the interval between bubbles. The 2017 bubble was the last fundamental mode, the 2021 was the first harmonic, and no bubble was expected for 2025 in this framework. The next bubble in Bitcoin measured in gold terms would be expected to peak in residuals sometime between Q4 2026 (lowest wavelet analysis value) and Q2 2027 (Fourier analysis value).
In a future article we will examine the bubbles in Bitcoin / USD terms in a similar manner.
Thank you for this work 🙏
I truly appreciate your work and I am striving to understand more and more of the science behind it.