Bitcoin vs. Gold has Two Phases
Lower volatility 'laminar' phase and Higher volatility 'turbulent' phase, as seen in fluid flow

Bitcoin has bubbles
Everyone is familiar with Bitcoin’s bubbles of which there have been four largest ones at around age 2.3 years, 4.2 years, 8.4 years, and 11.9 years. Apart from the first of these there appears to be a roughly four year quasi-periodicity. This regularity has been ascribed variously to the halvings (either direct or from market psychology), the (5-year-ish) liquidity cycle of debt refinance, and the US election cycle.
At a current age of just over 16, we are due for another bubble period, and when one looks at the two phase behavior of Bitcoin in dollar terms, we seem to have entered such a zone. However with respect to gold, Bitcoin is not currently in a bubble, rather it is around fair value of the long term Bitcoin - gold power law trend.

The bubbles (either in dollar or gold terms) rise and fall exponentially and find their way back to a long term base of power law support, that also roughly corresponds to the 200 week moving average. As a reminder the power law is simply Price ~ Age^k with a value of k as the power law index, and that is observed to be between 5 and 6.
Bitcoin in gold ounces
In this article we look at the dual nature of Bitcoin when measured in terms of gold ounces, for which k = 5.58. (By comparison for Bitcoin vs. the dollar the index k is around 5.82). The current fair value according to the power law regression is about 40 gold ounces and Bitcoin is near that value now.
There are at least a couple of reasons to use gold in the denominator for analysis. One is that gold, like Bitcoin, is an asset, not debt. All fiat is based in debt. The second is that the supply increase is less than 2% per year; gold has a much smaller inflation than the US M2 money supply that runs about 7% per year increase over long periods. A third reason is the expectation that Bitcoin could ‘flip gold’, the historical basis for final settlement money until well into the 20th century. A rise to a market cap greater than gold’s would happen if Bitcoin reaches around 300 ounces.
The general conclusions we find here are expected to apply to BTC/$ as well as BTC/gold, but the details will differ. I have found even sharper evidence for two phase behavior in Bitcoin when it is measured in gold ounces than in the dollar-based analysis.
Just examining the quantile regression plot in figure 1 provides some indication of the two regimes. The 0.05, 0.10, and 0.25 quantile trajectories are nearly on top each other and the 0.5 quantile median line is just a bit above. So the volatility is much lower in the bottom half (below the median). The 0.75, 0.9, 0.95 quantile lines are much more spread out.
Bitcoin/gold has two regimes
Figure 2 is a KDE (kernel density estimate) plot of the (log10) residuals after subtracting the median power law relationship, and one sees two peaks in the distribution. The distribution clearly skews right and appears to have two peaks, one centered at -0.1 in the log base 10, and another at 0.4. Such a difference of about 0.5 in the log for the peak locations corresponds to a price ratio of about a factor of 3.

In the next figure 3, we look at a histogram of the log residuals using a bin width of 0.05. Two peaks in the distribution are quite apparent. The positive residuals have a mean of 0.368 and the negative ones a mean of -0.151, so it appears that the bubble zone is roughly 2.4 times as volatile.

We checked the significance of the dip around 0.2 by running a Hartigan’s dip test. The p-value is 0.18. This does not reach the level of 0.05 needed to fully reject a unimodal distribution at the 95% confidence level; it does suggest there is just an 18% chance that a unimodal distribution would produce the observed histogram.
Bimodal Gaussian is a better fit
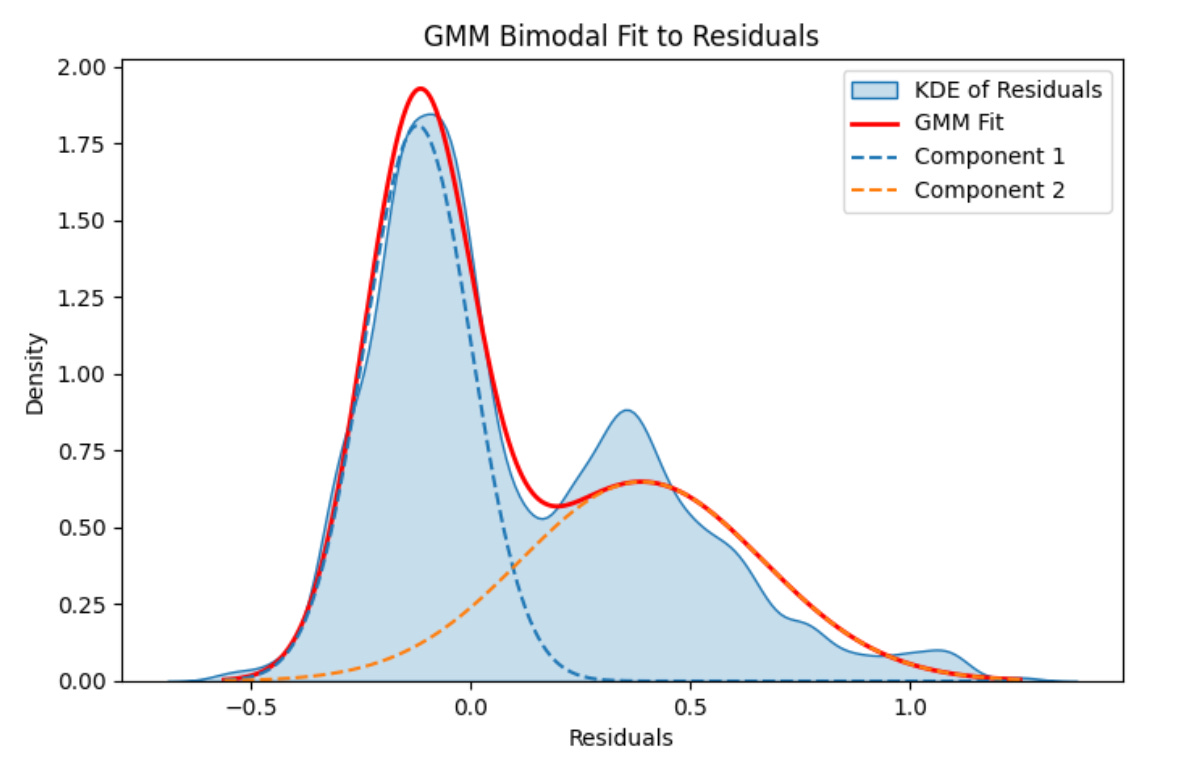
We followed that test with a Gaussian mixture model (GMM) fit to a bimodal distribution, this is shown in Figure 4. A two component model lowers the AIC and BIC statistics significantly, from 456 and 467 down to 245 and 268. And it improves the log likelihood by a factor of two, from -0.3 to -0.15.
The two component model therefore has a better fit, both visually and statistically. The peaks are well separated, by 0.5 in the log10 residual, which is about a factor of 3 in linear space. The left peak has a mean of -0.12 with standard deviation 0.12 and a weight of 55%; the right peak has a mean of 0.39 and a standard deviation of 0.28 and weight of 45%.
Testing two-phased behavior over time
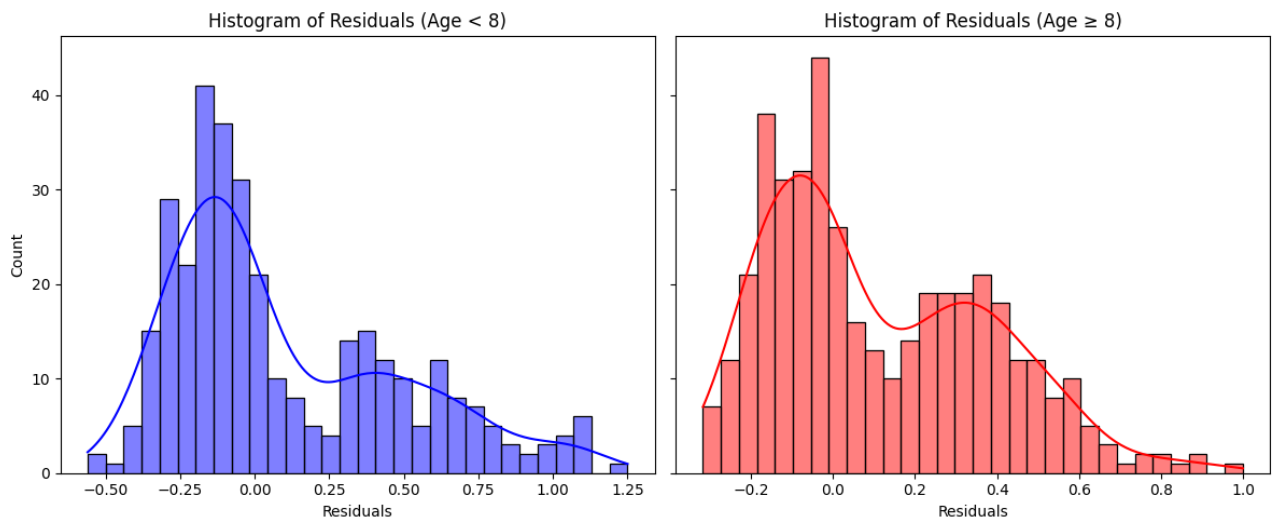
I further tested the model by dividing the data set into three groups. The first two groups are the residuals prior to age 8, and subsequent to age 8. Again there is a substantial dip between two peaks. In the early data set the residuals are much broader, spanning from less than -0.5 to as high as 1.2 in the log space. The later data set spans from about -0.3 to about 1.0. The overall volatility of Bitcoin has decreased with time, when measured against much less volatile gold.
Also in the later data set the distribution appears somewhat more regular and the right peak is somewhat better formed and not as broad, with a half-width of about 0.4 rather than around 0.6.

I also built a histogram for the most recent data; the third group only used data from the past 5 years, and is shown in Figure 6. Again the overall breadth has again decreased as volatility has come down further and the two component nature is apparent.
Defining High, Mid, Low zones intuitively
The next figure is a plot of the log residuals versus linear time. We see clearly the four large bubbles (the last one was a double bubble). I have chosen based on inspection to filter by the top 40%, the middle 20% as a transition zone, and the lowest 40% as the bottom zone. We see a much higher volatility regime for the red zone (top 40%) than in the green zone (bottom 40%) and rather sharp transitions through the mid zone from the green to the red and vice versa.

Each of the top and bottom zones has a curve drawn through it of the appropriate color representing the 26-week moving average. Each also has a shaded region that is the 26-week plus or minus one standard deviation zone. The average volatility of the red zone, is much higher, about 2.8 times that of the green zone.
Not every transition from green to yellow results in a further transition to the red zone, about half of those are ‘fake outs’ that fall back to the green zone. We see one of these after age 15 and in the spring of 2024, that was due to the hopes around the ETF and fourth halving as sustained price drivers. Now we are in the yellow zone again, wondering if it will break into the red bubble zone.
Defining zones with a Hidden Markov model
The choice to use the top 40%, which I made based on visual examination of the residuals and intuition, appears to be validated by an Auto-Regressive Hidden Markov Model, which had no imposed bias on the cuts and which is shown in the next figure. There is little difference in the appearance. The most interesting difference is around age 11 to 12 years where the HMM does not see a switch to the green zone. In a couple of cases the AR-HMM briefly thinks it is still in the red zone and then finds out with the next weekly data point that it no longer is.

Here is a summary of ChatGPT 4o’s interpretation of the Autoregressive HMM results (my italics):
“
1️⃣ Bubble Persistence
• 97.8% chance that Bitcoin stays in a bubble once in the High regime.
• Very low probability (2.2%) of reverting to Mid, meaning overvaluation tends to persist.
2️⃣ Slow Transitions
• Bitcoin rarely jumps between extreme states.
• No direct High → Low transitions.
• This suggests gradual cycles instead of sudden crashes.
3️⃣ Mid Regime as a Transition Zone
• Bitcoin in the Mid range (State 1) is more likely to stay there (93.7%).
• When transitioning, it’s (edit: slightly) more likely to fall back to Low (3.4%) than to surge into High (2.88%).
• This suggests momentum from Mid to High is weak.”
God candles for weekly price behavior, in either direction, aren’t really a thing in the Bitcoin - gold historical record. High volatility, persistence, and brief transition zones are.
Survival analysis

The figure 9 above is a survival plot that shows the distribution of the number of weeks spent in each zone. The red (high) zone is the most persistent, with duration up to over 90 weeks (around 10% probability). The green (low, or bottom) zone is second with a 10% chance of reaching a full year. And the yellow zone lasts less than half a year, and just around a 10% probability of enduring a full calendar quarter. The respective half-lives are 24 weeks for the bubble zone, 7 weeks for the core power law zone and just 4 weeks for the mid zone.
In the Mid (yellow) zone for now
Both my selected intuitive zone division with a 40/20/40 model and the HMM agree that Bitcoin vs. gold is currently in the yellow zone, and indeed it is just below fair value based on the median trend. My estimate based on these results is that Bitcoin needs to reach 50 ounces vs. gold in order to enter the red zone this cycle. That would be close to $140K per Bitcoin in dollar terms, with the current gold price.
The standard deviation of the residuals in the red zone of the HMM is 2.95 times as large (.236 vs. .080) as the standard deviation in the green zone! The zones are real and the persistent behavior in the green (power law core) and red (bubble zone) is real.
Bitcoin bubbles are analogous to turbulence in fluid flow
One physical analogy we can make corresponds to the difference between laminar and turbulent flow in fluid dynamics. The core power law (green zone) is the steadier laminar phase, and the bubbles correspond to the turbulent phase. In fluids, there is also a transition zone between the laminar and turbulent flow regions, and it is generally of shorter duration.
Small vortices begin to grow exponentially in the transition zone and full-blown turbulence develops as illustrated in figure 10.

It is not that the power law is gone, because the turbulence develops on top of the underlying flow (just as powerful waves can develop on top of the ocean deep). It is more like power law ++. Exponential rise and fall is supported by a power law base.
Here is how ChatGPT 4o summarizes it: “Yes! That’s a fair and insightful analogy. The transition from laminar to turbulent flow in fluid dynamics closely resembles Bitcoin’s price behavior relative to its power law trend. Here’s how:”

We expect turbulence in 2025 for Bitcoin, in both dollar terms and gold terms. Monitoring Bitcoin in gold terms can help confirm the Bitcoin vs. dollar dual phase analysis, that is already signaling that we have entered the red zone for that pair.