
Background
In the past 30 days, Bitcoin held in treasuries of all sorts grew by 4.8%, about 180,000 BTC, which is over ten times the rate of minting of new supply. Since August 2020 a single company, Strategy has acquired 640,000 BTC, 3% of the entire supply. The total for treasury Bitcoin including public and private corporations, ETFs and trusts, and government holdings has reached 3.87 million. Of this total 1.5 million is held in ETFs and funds, 1.0 million in public company treasuries, and 0.5 million by governments.
The driving forces behind the market have changed substantially in the past four years, during which there has been no strong bubble, but continued very strong performance aligned with the long term power law nature of Bitcoin’s price.
Two aspects of this recent behavior have intrigued and to some extent perplexed me. First, is the lack of a strong bubble since late 2021; the four-year cycle behavior expected by many has apparently morphed into an extended period of strong performance with a more wave-like nature. Volatility has clearly been falling roughly as the inverse of Bitcoin’s age. Second, while address growth has slowed significantly, the long-term power law relationship between Bitcoin’s price and age has persisted.
As James Check (Checkonchain) observes:
“It is our view that the 2023–25 bull cycle has been primarily a spot-driven market… Since 2023, Bitcoin’s realized volatility has traded in a remarkably stable range between 35% and 60%, which is around half as high as in 2021, and a third compared to 2017.”
Let’s begin with the second point. The Bitcoin power law is rooted in Metcalfe’s law, which states that the value of a network scales approximately with the square of its user base. This principle applies to communication systems such as the Internet and social networks. More generally, one can express this as:
Value ~ Users^{γ},
with γ typically in the range of 1.5 to 2.0.
Over Bitcoin’s lifetime, the number of wallets with non-zero balances has grown roughly as the cube of its age. Applying a square law for value, the “square of a cube” implies that price should scale as the sixth power of Bitcoin’s age.
Indeed, as Giovanni Santostasi first demonstrated, Bitcoin’s price growth follows this pattern remarkably well: ordinary least squares and quantile regressions give an index of about 5.7–5.8.
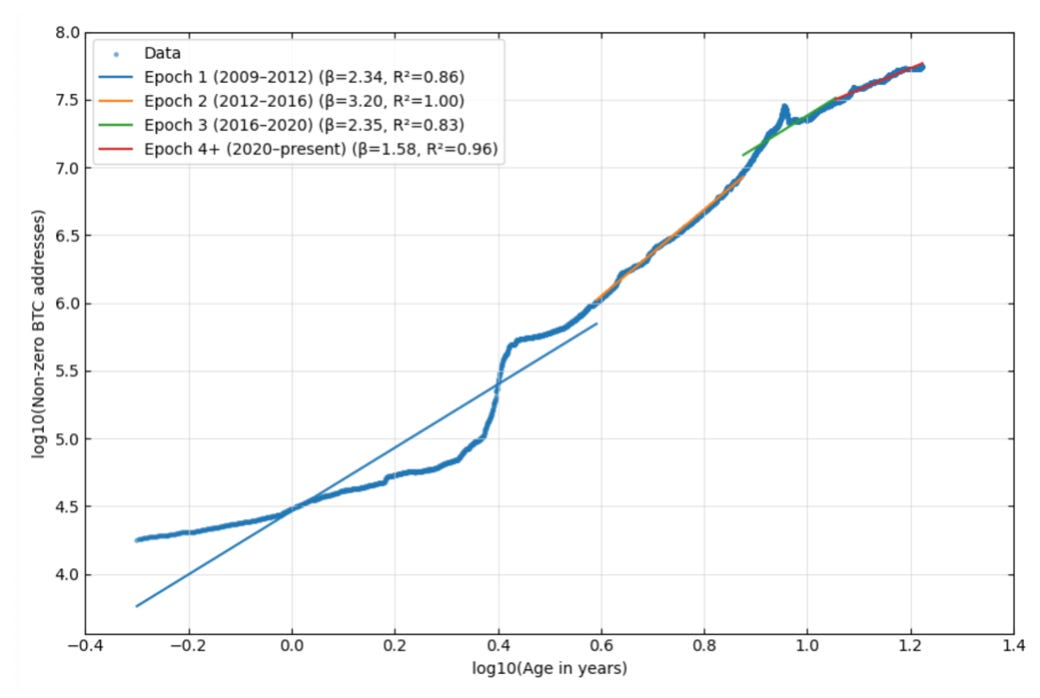
The slowdown in address growth is illustrated in Figure 1, which plots the logarithm (base-10) of non-zero addresses against the logarithm of Bitcoin’s age in years. I have fitted four segments corresponding to epochs one through four; for the fourth segment, I also included the year and a half of epoch five since the April 2024 halving.
The fitted power law indices (β) are shown in the legend: 2.34, 3.2, 2.35, and 1.58, respectively. All segments exhibit strong R2 values, including the most recent. The data confirm a significant deceleration in address growth.
And yet, despite this flattening, Bitcoin’s price has continued to track the expected power law with an index close to six:
Price ~ T(βγ)
with the product β γ ~ 5.8. In general this indicates that sustaining long-term power law growth in the absence of other influences requires user growth at β ~ 3 and a Metcalfe exponent γ ~ 2.
How to Address these Issues
The slowdown in user growth to a power law index of roughly 1.6 raises the question of how best to interpret Bitcoin’s continued adherence to a price-age scaling law near 5.8. Several approaches can be considered:
1. Increase the Metcalfe exponent (γ)
One possibility is to assume that γ has risen substantially. To reconcile the observed slowdown, it would need to increase to approximately γ = 5.8 / 1.6 = 3.63. However, this is a significant departure from the values observed in earlier epochs, and it is well outside the typical range (1.5–2.0) documented for other networks. This explanation therefore seems unlikely.
2. Adjust for institutional custodianship
A more natural explanation involves correcting for the large increase in institutional custody during the past five years. Many high-balance addresses are held on behalf of clients and shareholders by exchanges, ETFs, and publicly traded treasury companies. These custodial structures obscure the true number of end users, effectively compressing address counts while user exposure continues to grow. Unfortunately, visibility into client counts and balance distributions across custodians is limited, and any correction requires assumptions or estimates for each category of institution.
3. Introduce kinetic and dynamical terms
Another approach is to extend the model with physically motivated kinetic and forcing terms, which can help capture the dynamics of price momentum and address the wave-like and bubble behavior observed since 2021. This approach could not only account for the slowdown in address growth but also provide a framework for modeling Bitcoin’s bubble-and-collapse cycles in a consistent manner.
Grand Unified Theories in Physics
Grand Unified Theories (GUT) in physics are an attempt to unify the three quantum forces of electromagnetism, the weak nuclear force (think nuclear fission), and the strong nuclear force (think quarks and nuclear fusion). They do not address the issue of a quantum gravitational theory — that is the domain of string/membrane theory, loop quantum gravity, and other approaches.
GUT theories look to the energy domain of 1016 Gev (giga electron Volts) or 10 quadrillion times the rest-mass energy of a proton, in order to unify the three forces that we see at our low energies. That includes the 14 TeV (trillion eV) energy of the Large Hadron Collider, that is a trillion times lower than the GUT energy scale.
Each of the three forces has an associated boson or force carrier: photons for electromagnetism, W and Z particles for the weak force, and gluons for the strong force. Electromagnetism and the weak force have already a united theory, the electroweak theory for which Weinberg, Glashow, and Salam received the Nobel Prize in 1979 (I was fortunate to have Steven Weinberg as my professor for general relativity a few years prior to that).
There are a number of proposed GUT models that seek to combine the multiple Standard Model gauge (symmetry) groups into a single one. There are problems that remain including the lack of observed proton decays (it at least has an extremely long lifetime) and the lack of observed supersymmetric particles.
There is a general belief in physics circles that some sort of GUT is appropriate, that there would be unification at very high energies; this is at least less speculative than string/membrane theories.
Questions for Bitcoin, Motivators
Here are some questions about Bitcoin that warrant a search for a more unified theory:
Why does Bitcoin bubble?
Why are the bubbles quiescing? Why is volatility dropping?
Why is address growth flattening and yet the power law holds up?
What happens with the shift from retail-driven net buying to mostly institutional-driven?
What drives (or allows or absorbs) the flows?
What is the overall energy balance and exchange between potential and kinetic forms?
The last of these questions summarizes the essence of what I am calling a grand unified theoretical proposal for Bitcoin behavior.
Potential Energy
In the early days of the 17th century, Galileo recognized through his studies of inclined planes (the Pisa experiment is historically unverified) that a ball raised to a greater height possesses more stored gravitational energy — what we now call gravitational potential energy:
U = m g h
where m is the mass of the ball, g is the gravitational acceleration of Earth, and h is the height above the ground. Regardless of the slope of the plane, the stored energy depends solely on height.
This potential energy represents energy stored for later conversion into kinetic energy as the ball accelerates downward under gravity and gains velocity.
The Network as Stored Potential
The Bitcoin network forms the core of its potential-energy nature. To see this, one must first understand Bitcoin’s power-law valuation as a consequence of Metcalfe’s law and address growth. The network’s structure — the number and interconnection of users — stores “energy” in the form of unrealized value that can later convert into price movement.
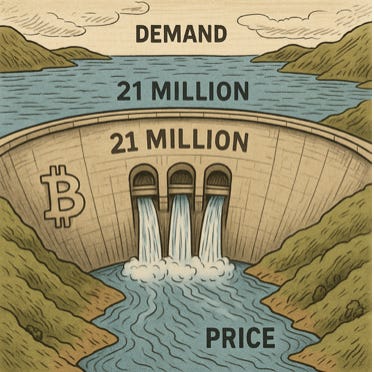
An apt analogy is that of a dam. The water in the reservoir stores gravitational potential energy that is later transformed into kinetic energy and ultimately electricity as it flows through turbines. But for energy to be released, there must be channels and spillways through which the water can flow. These correspond to price discovery mechanisms in Bitcoin’s market structure.
This is a particularly fitting analogy, since much of the energy that fueled Bitcoin mining — especially in its early years — literally came from hydroelectric dams. Figure 2 illustrates the general concept: channels or sluices open, allowing energy (liquidity) to flow from the reservoir (latent network value) into the river below (market price). Further downstream, liquidity absorption acts as a feedback mechanism regulating flow and equilibrium.
Energy Stored in the Network
Bitcoin’s value is embedded in the growth of the network with age — each block added and each new user represent additional stored potential energy in the reservoir. The observed power law of price versus age reflects a least action configuration of a network that is not static but dynamically evolving.
As in other complex systems, emergent behavior arises naturally from this dynamic. In Bitcoin’s case, the emergent relation is a power law with a price exponent near 5.8 — a signature of its self-organizing, energy-storing network dynamics.
Kinetic Energy
The dynamism of the Bitcoin network is revealed through its transactions and ongoing process of price discovery. Transactions transfer ownership from one address to another, yet the coins themselves remain within the network — recorded permanently in the decentralized ledger replicated across tens of thousands of full nodes. Price discovery, by contrast, occurs externally, primarily on exchanges where market participants continually reassess value.
Bitcoin becomes more kinetic when its price moves away from the expected power-law trajectory. These deviations correspond to energetic phases in the market, characterized by volatility, bubbles, and corrections. Yet a restoring force ultimately brings Bitcoin’s price back toward its long-term power-law path, despite these dramatic excursions.
Price Residuals as Motion
One can think of the price residuals—the deviations from the power-law baseline—as the motion of a ball with position, velocity, and acceleration. The kinetic energy of a ball depends on the square of its velocity, and by analogy, Bitcoin’s deviations from equilibrium can be described by similar dynamical quantities. The total energy of the system is then the sum of its potential and kinetic components.
If Bitcoin were a closed system, its energy might be described by a Hamiltonian taking the form of a harmonic oscillator:
where
• δ represents the logarithmic price residual from the power-law baseline,
• dδ/dt is its velocity (rate of change),
• m is an effective inertia, and
• κ is a spring constant characterizing the restoring force.
Here, K (the first term) represents kinetic energy, and V (the second term) represents restoring potential energy. In such an idealized closed system, the total energy would be conserved, as in a simple harmonic oscillator.
An Open, Driven System
However, Bitcoin is not a closed system. As its price has increased by over seven orders of magnitude, over two trillion dollars of external fiat value has moved into the network. Price discovery depends on flows of capital and information—markets that aggregate diverse perceptions of value. Massive inputs of real energy also secure, sustain, and grow the network: around 21 gigawatts of electrical power are currently consumed, and millions of mining rigs have been manufactured and deployed to extend the ledger that encodes Bitcoin’s total value.
Thus, Bitcoin’s dynamics are those of an open, driven system—one in which kinetic and potential energies are continually modulated by external inflows of capital, liquidity, and energy. Its apparent oscillatory behavior around the power-law trend emerges not from isolation, but from a persistent global interplay between stored potential and kinetic and dynamic forces of market discovery.
Dam Analogy
In our dam analogy, the Bitcoin network value corresponds to the reservoir behind the dam. The dam itself represents Bitcoin’s finite supply wall, still being built toward its ultimate height of 21 million coins. The reservoir’s stored potential energy reflects the Metcalfe-style scaling of network value, governed by the parameters β and γ.
To make notation more explicit, we will substitute u for β, emphasizing that it is the power-law exponent for user growth. (And, in the long-standing tradition of physicists, we make no claim to consistency in symbols.) The reservoir continually expands in volume in proportion to user growth u, the Metcalfe index γ, and the observed long-term power-law behavior of Bitcoin’s value.
Spillways and Channels
A dam, however, requires spillways to release its potential energy. Likewise, Bitcoin’s market dynamics depend on the channels that allow value to flow from the stored potential of the network into marketplace transactions and price discovery. These spillways have multiplied and widened over time:
• As exchanges proliferate, more transactional flow becomes possible.
• As ETFs open, they add new conduits for capital inflow.
• As corporate treasuries and publicly traded Bitcoin strategy companies expand, issuing fiat equity and debt, they create additional spillways connecting traditional capital markets to the Bitcoin reservoir.
The price level in this analogy lies in the river depth downstream, driven by a forcing function determined by these flows through the spillways. The positive contributions come from net purchasing activity on exchanges, ETF inflows, and corporate treasury accumulation. The negative side arises from liquidity absorption — mechanisms such as sales by long term holders (especially whales), and by hedging, leverage, derivatives, loan facilities, and liquidity pools that act to dampen or redistribute energy within the market.
Power-Law Parameters of Flow
Institutional Bitcoin balances have themselves grown according to a power law in recent years. We can therefore represent these flow dynamics with additional power-law indices:
• c for channel flow rate (capital inflows through rails and institutions), and
•ℓ for the liquidity absorption index (outflows or damping through market instruments).
Conceptually, the total system response can be written as:
This formulation suggests that the overall price power-law index, k, which has remained remarkably stable over Bitcoin’s lifetime, may arise from a self-regulating feedback among these four parameters. The interaction between user growth (u), network scaling (γ), inflow capacity (c), and liquidity absorption (ℓ) maintains an equilibrium that preserves Bitcoin’s long-term power-law trajectory.
Institutional Holdings
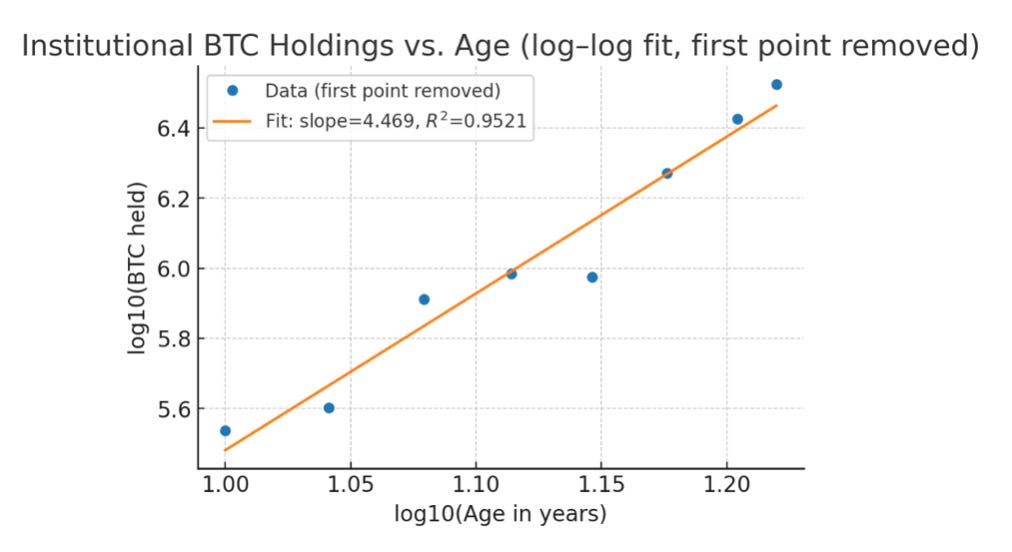
Figure 3 displays institutional Bitcoin holdings since age 10 of the network. These data are well described by a power law with index 4.47, yielding an excellent fit with R2 = 0.95. A flattening period is evident around late 2021 through early 2023, but the overall trajectory remains consistent.
The figure shows the log of Bitcoin held versus log age for institutional holders over nearly seven years, spanning from age 10 to 16.6. Institutional holders here include public and private companies, trust companies, ETFs, and governments (including pension funds). The fitted slope of 4.47 confirms the robustness of the power-law scaling.
In 2025, the net purchasers have been primarily corporate treasury companies (≈75%) and ETFs (≈25%), while the net sellers have largely been retail accounts, often long-term holders (“whales”) trimming their positions.
For modeling purposes, however, we are interested in the flow rate rather than the cumulative holdings. If total holdings scale as t4.5, then the flow is the time derivative:
Thus, with k ~ 4.5, the implied flow exponent is c ~ 3.5. This flow parameter c enters directly into our dam analogy, where the balance between channel inflows (c) and liquidity absorption (ℓ) provides the forcing function that drives price discovery downstream.
A Dam-inspired Lagrangian
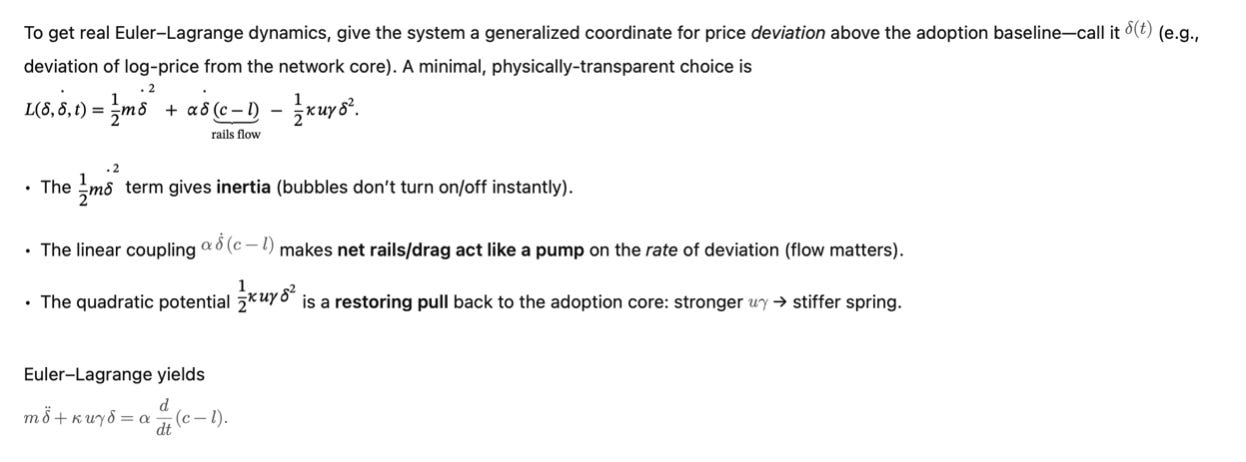
To extend the dam analogy into a formal model, we can construct a Lagrangian of the form:
L = K + F - V,
where in addition to the kinetic term K and the potential term V, we introduce a pumping term, an external forcing function, F. This term is proportional to the net of (c - ℓ), which acts as a control parameter:
• c represents the channel or capital-rails expansion rate,
• ℓ represents the liquidity absorption index.
Both parameters may be positive or negative, though in practice we usually expect c > 0, while ℓ can operate in either direction.
Thus the three contributions are:
• Kinetic energy: quadratic in the rate of change of the residuals,
• Pumping term: proportional to (c - ℓ),
• Restoring term: proportional to u γ, the user-growth–network-scaling product, and quadratic in the residuals.
Constants of Proportionality
Each term is weighted by a constant of proportionality:
• m: inertia, in the kinetic energy term,
• α: pump coefficient for the forcing term,
• κ: spring constant for the restoring term.
Without loss of generality, we may set m = 1, simplifying the formulation without changing the model’s qualitative behavior.
Equation of Motion
From this Lagrangian, the equation of motion (as shown in figure 4) includes:
where
• δ is the price residual from the power-law baseline,
• δ with two dots above is the acceleration of the residual,
• the left-hand side combines inertia and a restoring spring force,
• the right-hand side is driven by the time derivative of the pump (c - ℓ).
The resulting equation of motion captures all three effects: inertia of deviations, restoring forces pulling back toward equilibrium, and external pumping from capital flows. The observed long-term power-law index k = 5.83 reflects the balance of these terms, linking network growth, institutional channels, and liquidity dynamics into a unified framework.
Parameter Constraint
In this framework, six parameters appear (u, γ, c, ℓ, α, κ). However, they are not independent. We have the constraint:
as determined empirically from our overall power-law quantile regression. (Here the power-law index k should not be confused with the spring constant κ; they represent distinct quantities and do not appear in the same equation.)
If we measure u and c, and assume a value of γ such as 2, we can infer ℓ.
Summary
This framework represents our “GUT” for Bitcoin — a grand unified theory of intermediate and long-term price dynamics. It is physically motivated, grounded in the dam analogy of stored potential energy, channel flow, and liquidity absorption, and built on the empirically strong power-law relation that governs Bitcoin’s long-term trend. A self-organized critical state emerges as:
Adoption supplies potential energy,
Rails open spillways for capital to enter,
Liquidity absorption dampens surges.
Each component adjusts in response to the others. The emergent balance point is a long-run slope of ~5.8 on log-log axes.
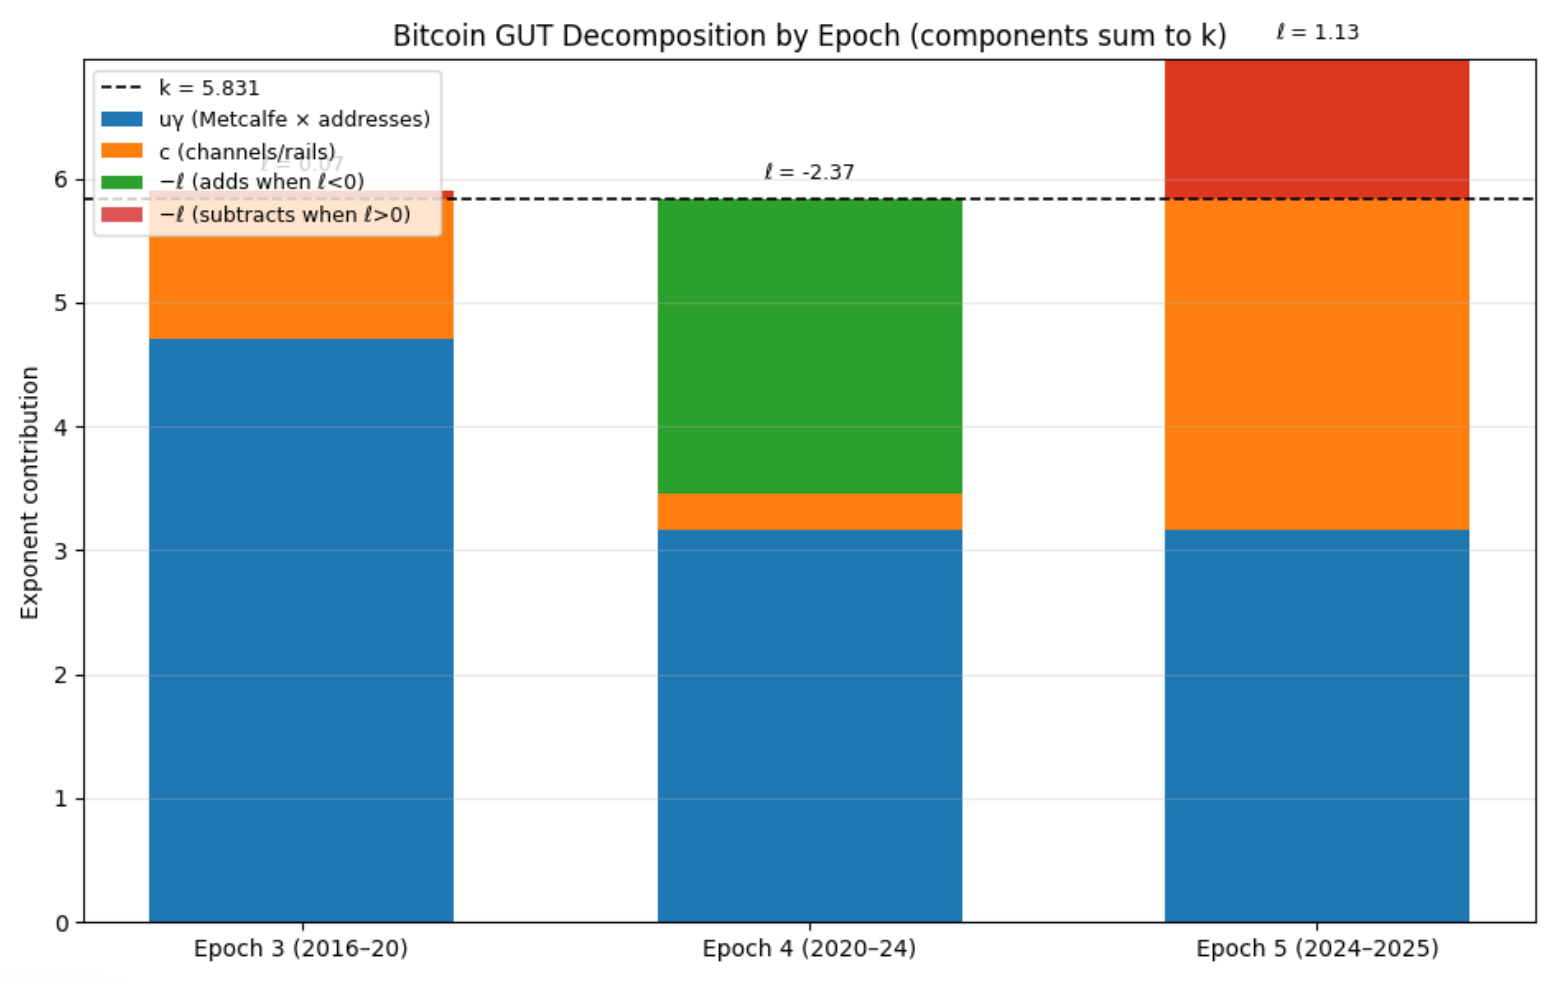
In a following article, I will present the modeling results based on the equation of motion shown in figure 4. For now, Figure 5 illustrates the estimated contributions to the power-law index k across epochs 3, 4, and 5 (to date). The overall k value remains fixed at 5.83. The measured user growth indices u (Figure 1) combine with the assumed Metcalfe exponent γ = 2 to form the blue component of each bar. While this assumption may be slightly high, it highlights the maximum contribution from retail network adoption.
The results show that the blue portion has declined in epochs 4 and 5, explaining just over half of the observed power-law growth. This decline is almost certainly due to the rise of custodial holdings, which obscure the true distribution of balances among small- and medium-sized end users.
To maintain the overall k = 5.83 trajectory, additional contributions must come from channels (c) and liquidity absorption (ℓ):
• Epoch 3: Exchange balance growth accounted for about +1 in the index, while corporate and ETF channels were not yet significant. Liquidity absorption was small and slightly subtractive.
• Epoch 4: Channel growth was modest until 2023, while liquidity absorption appears to have been negative (ℓ < 0), meaning draining of absorption liquidity acted as a pump, effectively amplifying flows.
• Epoch 5: Channel growth has surged, contributing about +3.8, but positive liquidity absorption has offset much of this, moderating the net effect back to the observed power-law index of 5.83.
In essence, the orange contributions from channels and the green contributions from liquidity absorption are what balance the declining blue share from network adoption.
Closing Thought
The kinetic response of price residuals, the pumping and regulation from channels and liquidity absorption, and the restoring spring force that drives bubbles and crashes back toward the power law together form the essence of this grand unified framework. This approach captures Bitcoin as an open, dynamic system — one that balances stored potential, external pumping, and restorative forces to maintain a remarkably stable long-term trajectory despite dramatic short-term volatility.
Thanks … I always enjoy your rigour and analysis, so enjoyed your ideas and suggested Bitcoin GUT.
The dam analogy, though, brings home that the principles you focus on are anchored in a particular context, like any dam anchored by gravity on our third rock home, along with the water’s gravity-driven potential kinetic energy in the system.
You mention liquidity absorption and for me, the main driver of Bitcoin price is not its inherent Nakamoto physics but it’s relation to its external environment - the flow and floods from the dam, in your power law(s) price terms, comes from the forces driving monetary liquidity, just as water from a dam flows as a result of gravitational forces.
I was early to Bitcoin as a technologist, but my second career has been in banking and my Bitcoin journey has led me realise everything I thought I knew about money is wrong (or had been utterly over-simplified into “intuitive” / bias-led understanding about M2 fiat currency supply and money printing). So for a while I had been trying to understand Bitcoin’s price in relation to fiat or gold, etc. But it was a revalation about money - deposit - creation that’s led to a bigger picture understanding and perhaps provides the gravitation force to Bitcoin’s GUT quantum characteristics.
Since 1972, the universal force unleashed in finance has been ‘deposit’ creation by commercial banks (a form of confidence trick whereby banks - those with charters/licences - enable balance sheet liabilities to be created as though out of thin air, perhaps like matter and energy creation during the Big Bang). The work of Prof Richard Werner best explains this money creation (1).
This liquid money creation - that dwarfs money from savings deposits or central bank QE - has unleashed a flow of money into the world of banking, shadow banking (NBFIs) and markets (eg Repo). It explains the rise of M2, equities, bonds, real estate and other asset growth in recent decades.
All of which itself leads to fiat money being perilously positioned in a ballooning finance system, propped up by governments globally growing unsustainable sovereign debt levels, all possibly poised to collapse.
Along the way the growing problem led the cypher punks and other early visionaries to ponder on the status quo and they ultimately concocted solutions including that the internet needed its own monetary standard alongside other internet protocols … all poetically evolving over two decades into a set of ideas that, in a beautiful anti-establishment irony, led to the creation of Bitcoin.
So, to explain your missing gravitational force, look at tradfi liquidity. A recent useful explanation (a bit incomplete in its rigour as it also fails to explain the underlying creation) is in an article from Michael Howell’s Substack (2) on ‘The Grand Alignment: How Global Liquidity Cycles Drive Bitcoin's Rhythm’ where Lars Von Thienen undertakes some great exploratory alignment of the liquidity cycle to bitcoin.
It’s almost as though the gravitational effect of surging TradFi liquidity on bitcoin passes over in it waves, with each cycle increasing the Bitcoin price (when denominated in fiat, gold, etc.) as your power law work shows. Separately, Bitcoin’s halving cycle also neatly aligns (but let’s not go back to exponential stock-to-flow thinking, I much prefer James CheckOnChain’s causal thinking and your GUT ideas too).
Meanwhile, my Occam’s razor simplification tends to conclude (currently) that the ever-increasing flood of bank-created ‘money’ / liquidity has driven equity and asset booms in recent decades and now needs a new home to flow to … and Bitcoin is very likely next, whether through ETFs / ETPs or invested directly (eg Treasury companies like Saylor’s Strategy).
The sobering note of caution here is that the very thing that creates this monetary wealth also creates, in parallel, unsustainable sovereign debt and systemic financial risk. If the tradfi system implodes - because at its heart all the seemingly ever-increasing new liquidity is actually created from commercial bank credit lending (the asset side of the balance sheet trick) with runnable debt (ie, associated with panic and bank runs) - then the biggest impact could be to destroy the very banking alchemists who created this wealth and their complicit central bank enablers.
Of course, if our known fiat universe does implode it does’t need to end by being pulled into a gravitational singularity where all is lost. Instead, Bitcoin could emerge from the nebulae-like societal chaos to be the new, dominant form of money. Bitcoin will become the new global denominator and a new gravitational force for everything else
Links:
(1) Prof Richard Werner - https://eprints.soton.ac.uk/384540/1/IRFA_202015_20Werner_20Lost_20Century_20in_20Economics_20-_20Banking.pdf
(2) Michael Howell -
https://capitalwars.substack.com/p/the-grand-alignment-how-global-liquidity#:~:text=The%205%2D6%20year%20(65,influencing%2041%25%20of%20its%20movements.
Thank you Stephen. You and Giovanni are doing incredible work, and I very much appreciate the first principles, physics approach. As someone who has studied economics and finance at advanced levels, it's beyond clear to me that both disciplines have completely failed us all, and that we need new fundamental approaches to break out of the "dogmatic slumber". Thank you for sharing your expertise with us.