This is not investment advice. Bitcoin is highly volatile. Past performance of back-tested models is no assurance of future performance. Only invest what you can afford to lose. You must decide how much of your investment capital you are willing to risk with Bitcoin. No warranties are expressed or implied.
Previously I wrote about the Kelly criterion applied to a two-asset portfolio of cash and Bitcoin. The Kelly criterion seeks to maximize the log wealth over many return events, and has been shown to be optimal. Betting less is sub-optimal, but so is betting more than the optimal Kelly fraction or allocation.
The optimal sizing for a two-outcome bet or two component portfolio allocation can be determined by the Kelly growth criterion, which grows the expected value of the log of wealth more rapidly than other methods. We assume a portfolio with only cash and Bitcoin in some proportion.
The optimal fraction of such a portfolio toward the risky asset is f = (b*p - q)/b, where p is the expected win percentage, q the loss percentage, and b is the ratio of average win size to average loss size. For the trivial case of equal [sized] wins and losses b = 1, the optimal fraction is just p - q, so if your expected win percentage were 60% you would allocate 20% of your portfolio to a bet or a stock or to Bitcoin (because q = 40%).
Win percentage can be determined by picking a time frame of interest and looking at historical returns.
In that article we showed that using four and a half years of monthly data that the optimal fraction was 0.328. In other words you could allocate up to 32.8% of a two-asset portfolio to Bitcoin and it would have a long term expected average return of 11% per month. This assumes monthly readjustment (since monthly data was used) to the optimal fraction, which itself should be recalculated as new data comes in.
The beauty of the Kelly approach is you are always being nudged toward the 'efficient frontier’.
Now Bitcoin is highly volatile, volatility has come down somewhat lately, but it is the high volatility that requires keeping the allocation within reason. Not only does this lessen drawdown, it provides the opportunity to increase the share after a drawdown.
Timeframe matters. If you only looked at yearly time intervals, and only adjusted your allocation once a year, you would find a very high allocation is supported due to Bitcoin’s strong underlying trend. But since there are only 15 such intervals, this timeframe doesn’t provide good statistical robustness. Your drawdowns would also be very large.
For this article and update, I examined the last five years of daily BTC-USD data (downloaded from Yahoo Finance) to look at the timeframe dependency especially. I filtered weekly, monthly, and quarterly data from the dataset as well as analyzing daily data.
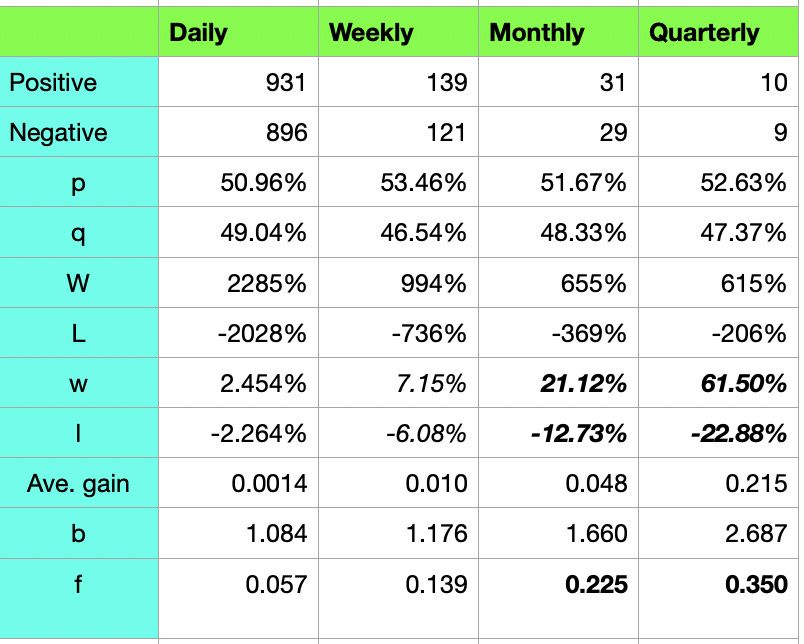
The table below summarizes the Kelly statistics. For example, the weekly column shows 139 positive return weeks, amounting to 53.46% of the time. The total of all percentage returns from winning weeks sums to 994% (W), so the average win (w) is 7.15%. The average win was just over 1% better than the average loss. So there are two “edges” for Bitcoin: one is that the average weekly bet wins, with a 7% differential, and the other is that it has a higher return than the average loss.
It is important to notice how the edge for wins, parameter b, grows as we look at longer timeframes. The win rate does not get much above 50% but the b edge grows significantly larger as we zoom out.

In the second table we look at the expected returns based on the historical data. The formula for this is: expected return = p * ln (1+b*f) + q * ln (1-f). The important point is this depends on (a) the time frame, and (b) requires the investor or trader to rebalance at each chosen interval. The rebalance brings the allocation back to the optimal f by selling some of the “stack” or adding to it appropriately.
Note that the expected return per time interval rises dramatically as the time frame grows, in rough proportion to the length of the time frame. But the per month return is in the range of over 4% to under 5.5% per month, for all intervals. And yet, referring back to Table 1, the optimal fraction is 6 times larger for quarterly decisions (investing) than it is for daily decisions (trading).

If you are trading daily or weekly you might have something like 5% or 14% as a maximal allocation.
Suppose you hold Bitcoin as a long-term investment and insurance against fiat inflation. You have a total allocation budget of up to 35%. You could allocate up to 30% into your “quarterly stack” investment portion and 5 % into your “daily stack” portion for trading. If you just ‘need’ to trade. You would apply quarterly readjustment to the first stack and daily readjustment, buying or selling to match the optimal f value, to the second stack.
You already have 72% annual expected outcome in that case for the bulk of your Bitcoin, trading would only add a little bit to the expected outcome for a small portion.
The main message these results are showing us is that you can allocate more if you have a longer timeframe, and that it is easier to manage, since you might make adjustments to stay near the optimal allocation only monthly or quarterly or even annually.
Bitcoin is primarily a low time-preference asset for holding long term.


Thank you for this wealth of information and analysis. I did have a couple of questions, as this analysis seems divorced from the reality of taxes in the US, in particular. (1) Does this analysis change when accounting for capital gains tax, short and long term? And, with this taxation issue in mind, and after also reading your 2020 post comparing multiple trading/hodling approaches, wouldn't buying and hodling monthly outperforms everything, while selling only the extended 10% periods when needed for USD? Thanks again!