Bitcoin’s Strong Persistence: Structure Revealed
Confirms a layered system with log-periodic structure and long-term external influences

Executive Summary
Bitcoin may be best understood not as a traditional financial asset but as a growing complex network whose market price reflects scaling laws of adoption and connectivity.
A Hurst and Detrended Fluctuation Analysis (DFA) study confirms that Bitcoin exhibits extremely strong persistence even after removing the well-known power-law growth trend and also the dominant log-periodic wave (bubble) structure.
The results reveal a layered system consisting of a scale-invariant power-law backbone, log-periodic oscillations, and persistent residual dynamics likely driven by macro-financial regimes.
Prior Work
Bitcoin’s strong persistence is structural, reflecting its nature as a network. And the structure is layered. From my article applying the Hurst exponent method a year ago:
“Bitcoin’s price demonstrates high persistence, or trending behavior on long timescales, and one can measure its Hurst exponent in order to show that.
“Bitcoin is a meta-network and adheres to Metcalfe’s law for network adoption, and has complex price dynamics, so it is natural to consider the Hurst technique to analyze its behavior. Others have done this, but here I introduce the first use of a Hurst analysis that recognizes its power law nature.”
Bitcoin’s Strong Persistence

Bitcoin’s price history and adoption history have demonstrated its anti-fragile nature and its Lindy nature. In the technology field the Lindy effect is the likelihood of a technology surviving an additional period of time based on how long it has already survived.
Here I revisit and sharpen the analysis, using both the traditional Hurst R/S method and the DFA technique to demonstrate the reality and strength of the log periodic waves superimposed on the long term power law trend. I also demonstrate a four-layered nature of Bitcoin price behavior.
The Hurst R/S technique
British hydrologist H.E. Hurst developed the rescaled range analysis and Hurst exponent method to measure the long-term storage capacity of the Nile river. He published his method in 1951 and by now it has been widely used in various fields including environmental science, geophysics and seismology, image processing, neuroscience, physics of complex systems, network analysis, and finance and economics.
In typical financial studies the Hurst exponent is applied to log returns without removing long-term structure. Because Bitcoin follows a strong power-law growth trend, detrending by the power law is necessary in order to isolate the true multi-layered fluctuation dynamics of the network.
The method examines how the rescaled range R/S grows as the window size N increases. The range R and the standard deviation S are each determined as a function of window size. The way it proceeds is that one samples the data with many window sizes N to produce the ratio R/S as a function of size N, and then fits that curve to a power law to measure the Hurst exponent:
R/S ~ NH
The value of H normally ranges in [0, 1] and tells you how strongly the series exhibits long-term memory. Is it trending, mean-reverting, or simply noisy? If H = 0.5 one has a series characterized by random noise; if H is small, near 0.0, it is strongly mean reverting, and if H is large, approaching 1.0, it is strongly trending.
For Bitcoin we want to detrend by its power law, that is the appropriate method since we know the long-term power law relationship is dominant, with R2 = 0.95.
Here I used weekly data extending from July 2010 to early February 2026, fitting the data to a power law using quantile regression at the median (0.5) level. One finds very similar results using OLS (ordinary least squares), also performed in this study, but QR (quantile regression, median) is in general less influenced by the strong bubbles and troughs of Bitcoin’s price history.
Once the power law of log10(Price) = -2.149 + 5.862 log10(Age) is subtracted out (this is the QR best fit) one has first stage residuals that can be analyzed for the Hurst R/S.
Upon detrending with both the usual method and with power law fits, the results for H, as well as DFA, are:
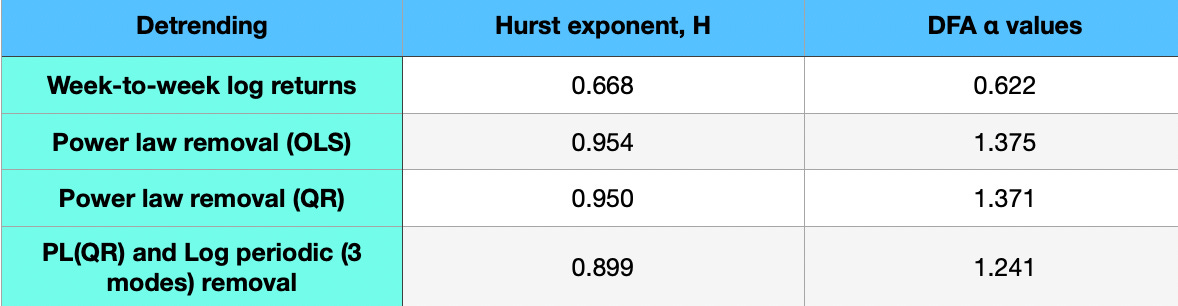
These results are striking. Typical financial return series such as the S&P 500 have Hurst exponents near H ≈ 0.5, consistent with near-random behavior. One might see a bit above 0.5 with some financial series, but 0.67 with typical log return detrending is quite high.
Bitcoin instead exhibits strong persistence and long memory. After removing the dominant power-law trend, the Hurst exponent remains extremely high at H ≈ 0.95.
This suggests that Bitcoin has:
• strong persistence
• long memory
• trend reinforcement beyond simple random walk behavior
And when we used residuals that are more appropriate to the Bitcoin network’s known behavior, with residuals defined as log price difference from the power law trend, the results are extremely strong. H = 0.95 is very near to the maximal 1.0 value, regardless of whether the power law is fit with an OLS or QR technique.
For the rest of this analysis I use the QR power law detrended residuals as a starting point.
Log periodic fit
Once the power-law trend is removed, the first-stage residuals reveal a clear oscillatory structure. This can be modeled using log-periodic functions that capture the hierarchical timing of Bitcoin’s major bubble cycles.
Most of the log periodic power is in the fundamental mode, but I also analyzed results with the first subharmonic and first higher harmonic. We have from prior work a characteristic λ parameter that Fourier analysis reveals to have a value of 2.07, and that corresponds to a wave frequency parameter ω = 8.63, via the relation ln λ = 2π/ω . The first subharmonic is at half that frequency and the first higher harmonic is at twice the frequency.
A λ ≈ 2.07 scaling ratio is extremely close to the value seen in several natural hierarchical systems such as earthquakes, rupture cascades, fluid turbulence, and even financial bubbles. The prior work is found here:

For generality I also including decay in the fundamental and first harmonic, but not in the subharmonic. The decay was of the form of a reciprocal of age A, as ~ 1/(A+2). I ran with and without a leading offset term and similar decay and that improved the fit slightly.
The fit quality was good for a financial series, with R2 = 0.52 and almost all of that is due to the fundamental mode. The Hurst exponent was evaluated against second stage residuals after removing the log periodic fit and is equal to 0.899, shown in table 1, still very high. Including the two harmonics changed the value by less than 0.01.
The overall picture is of a power law backbone and a decaying fundamental log periodic dominant second-stage oscillation. The other modes are minor influences. Even after removing the log periodic behavior including an offset, substantial persistence remains.
This may well be due to external macro influences since other harmonics are likely to be weak. But the log periodic behavior appears to be real and strong based on these results.
Bitcoin appears to behave like a driven scale-invariant network near a critical regime, producing discrete scale invariance (log-periodic cycles) and strong long-range persistence. We confirm this with DFA analysis in the next section.
The log-periodic scaling ratio λ ≈ 2.07 applies to Bitcoin age, not directly to price. Because price scales as the kth power of Age with k ≈ 5.8, successive major hierarchical levels correspond to price or market-cap thresholds separated by roughly λ k, or about 70-fold! My conjecture is that the log-periodic hierarchy reflects the sequential unlocking of progressively larger and more demanding tiers of capital, each requiring a greater level of market maturity, regulatory clarity, liquidity, and safety, and including lower volatility, as compared to the prior tier.
DFA
Detrended Fluctuation Analysis (DFA) has been used in physiology, with climate data, and in econophysics. Introduced in 1994 by C.K. Peng in the study of DNA sequences. It is a related tool to Hurst method also used in analyzing long range dependence in time series.
Instead of using the raw range R, DFA:
1. divides the series into windows
2. removes the local trend in each window
3. measures the RMS fluctuation
F(s) and then F(s) ~ sα is fit to determine the DFA α value.
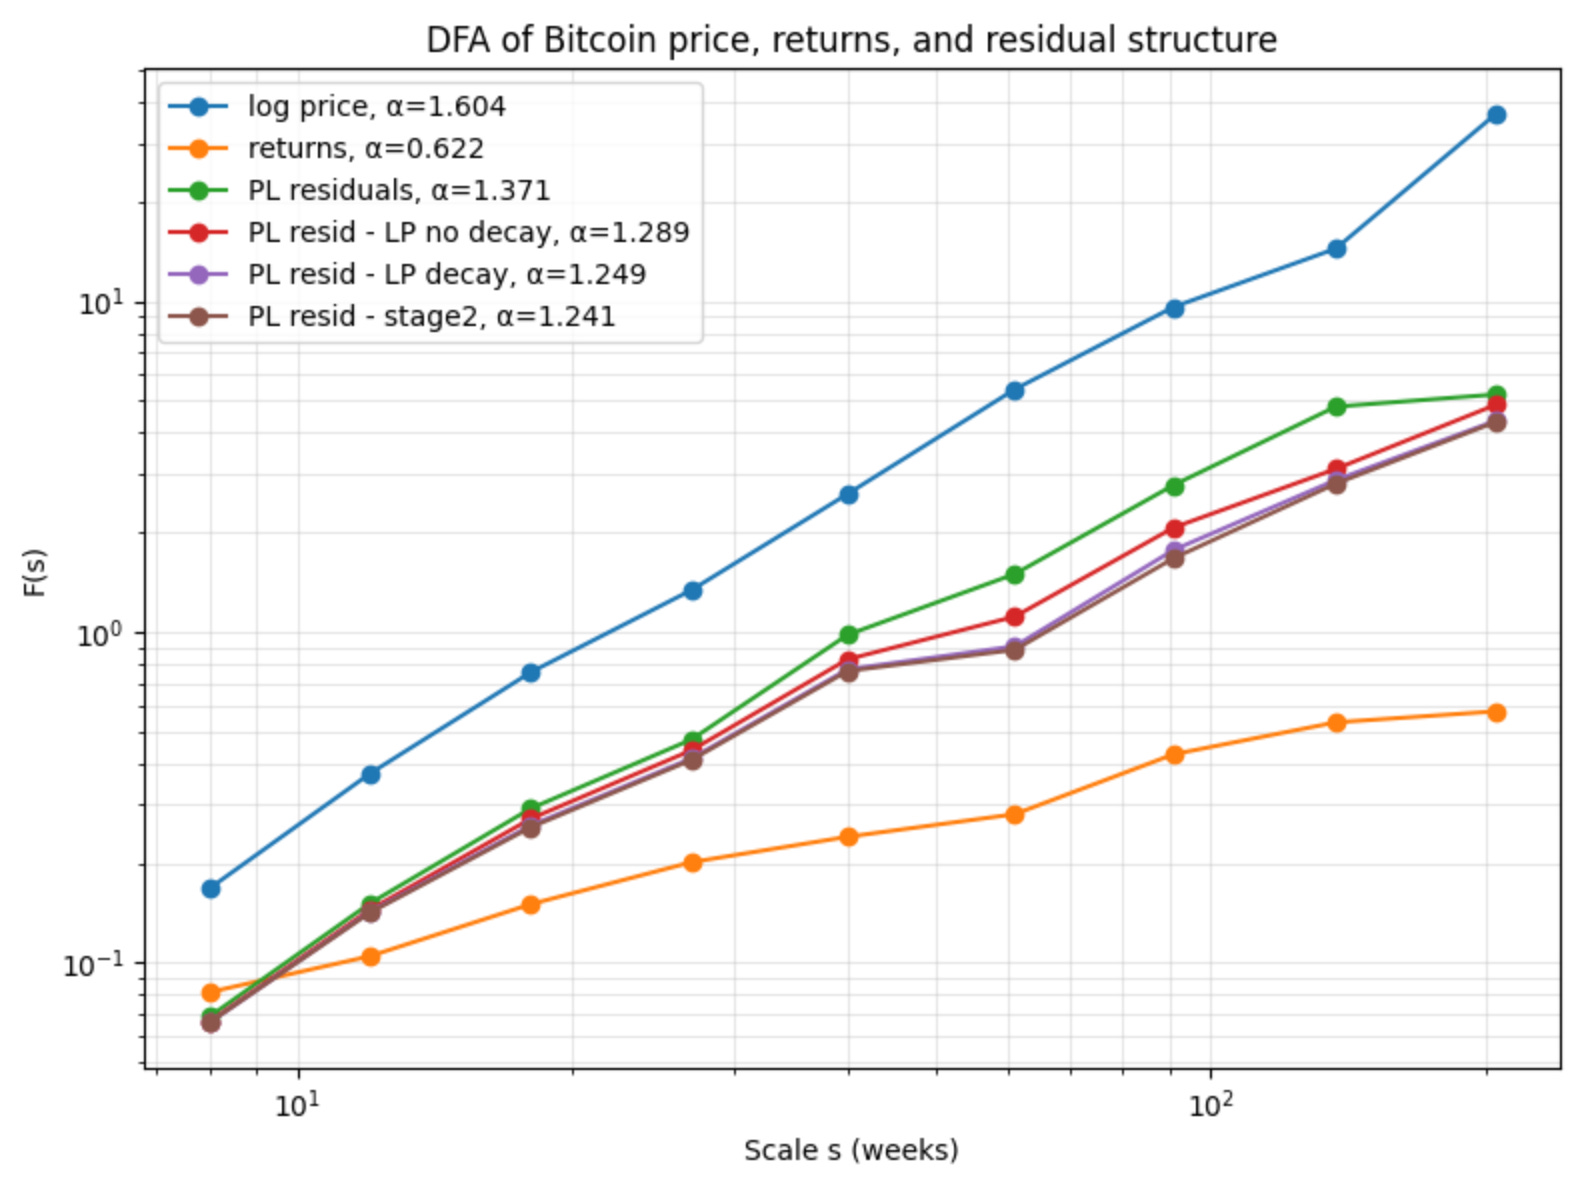
The results from the DFA analysis are also shown in Table 1, and in Figure 2. Even the log return α exponent is higher than typically seen in financial series at 0.62. But the real message is in the α values of 1.37 seen from the residuals after removing the power law, and around 1.25 for each of the three variants I ran that remove the log periodic modes as well. Those are quite high values, also indicating strong persistence for an integrated long-memory process, and confirming the Hurst R/S results.
This is very supportive of the reality of the proposed log periodic structure in addition to the power law structure. And it is indicative of additional long memory effects likely due to macro ‘drift’ — the influence of exogenous conditions such as financial conditions, yields and spreads, macro liquidity, regulatory and news events, and the flow of higher tiers of capital into the Bitcoin ecosystem.
In fact the alpha values determined are just mid-way between what is expected for 1/f flicker noise (1.0) and for Brownian motion (1.5). That’s indicative of a persistent, integrated long-memory process driven by slowly varying external forcing.
Conclusions
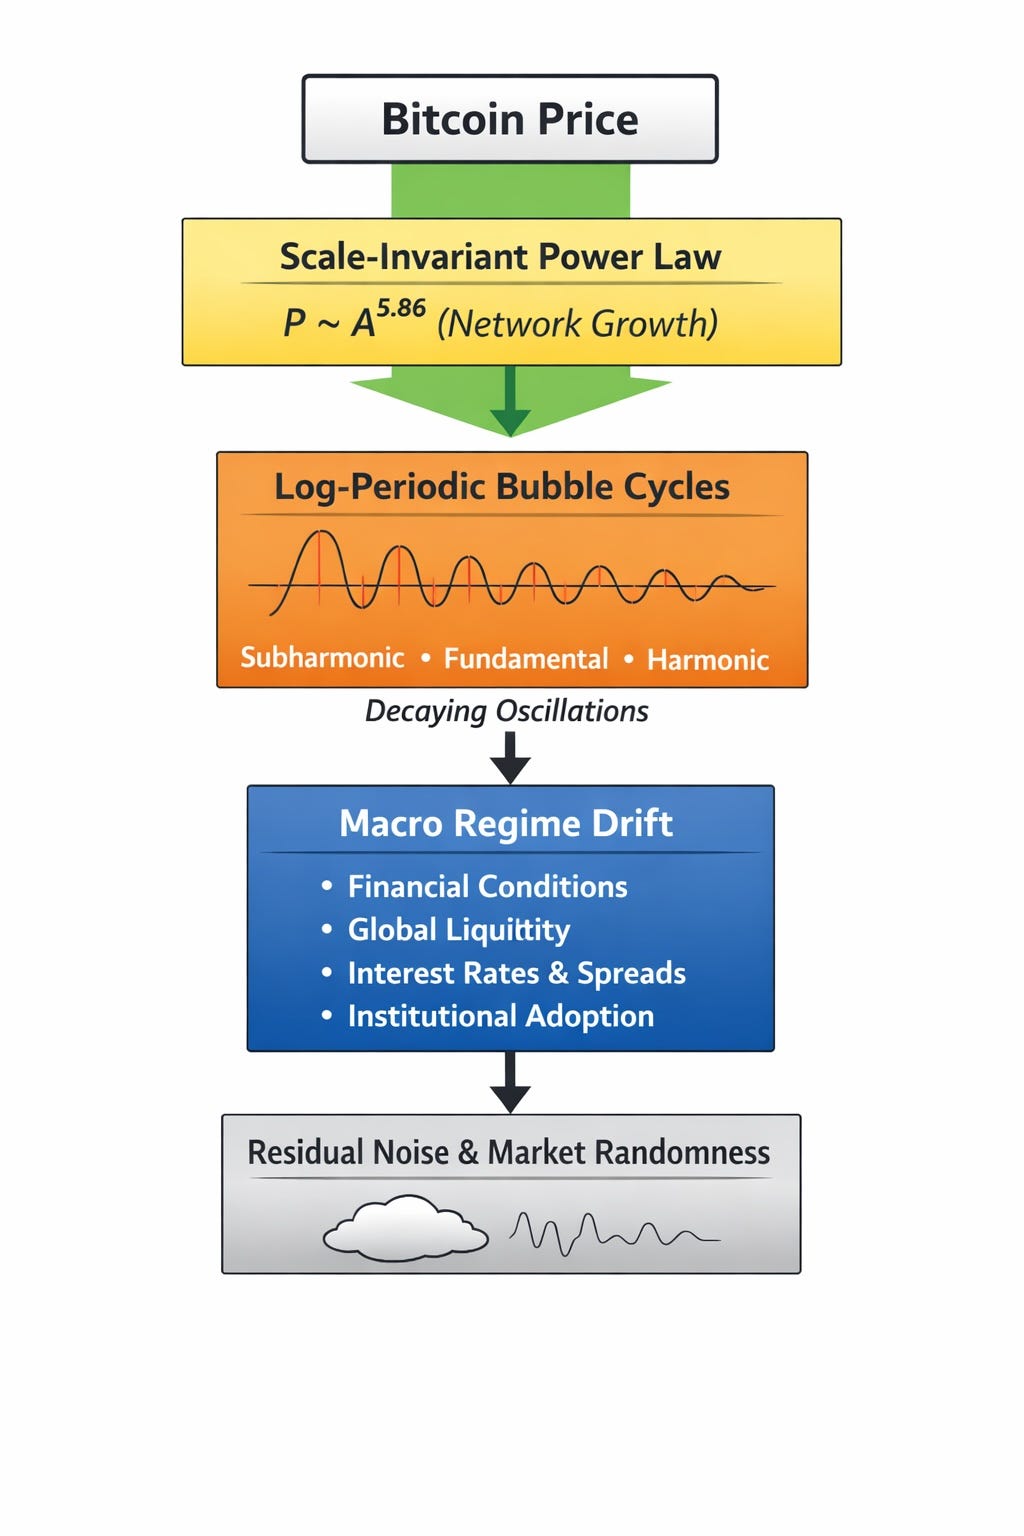
Bitcoin price dynamics appear to be governed by a hierarchical structure. And we have coexistence of scale invariance, discrete scale invariance, and long-range persistence; that, taken together are consistent with dynamics near a critical regime in complex systems.
The long-term trajectory follows a scale-invariant power-law attractor, upon which discrete log-periodic oscillations are superimposed. Even after removing both the power law and the dominant log-periodic modes, strong persistence remains in the residuals, indicating additional long-memory dynamics likely driven by macro-financial regimes. Long term price trend returns to the power law after major excursions, whether those are large bubbles or slower upward waves, or depressed prices and troughs. In brief:
• the power law governs the secular evolution
• the log-periodic mode governs the timing of major cycles
• smaller corrections account for maturation and regime effects
• stochastic fluctuations ride on top of that structure.
Key empirical conclusions for this work are therefore that Bitcoin has a hierarchical structure as shown in Figure 2, and that:
1️⃣ Bitcoin exhibits a stable scale-invariant price attractor.
2️⃣ Bubble timing follows log-periodic discrete scale invariance.
3️⃣ Oscillation amplitude decays as the network matures.
4️⃣ Roughly half of the first stage residual variance is structured.
5️⃣ Remaining persistence (after log periodic wave removal) likely reflects macro-financial regimes.
6️⃣ Bitcoin behaves like a driven nonlinear complex system, operating in a self-organizing (autopoietic) manner
These results support the idea that Bitcoin does not behave like a conventional financial asset but rather more like a self-organizing complex network subject to external forcing.