Global Liquidity as a Driver of Bitcoin
Bitcoin is a power law of liquidity; Liquidity growth kicks off bubbles

Bitcoin price follows a power law vs. liquidity
It is well understood that global liquidity is a long-term driver of risk asset prices, including stocks and Bitcoin. More money in the system, more ammunition for buying. It has been noted by Michael Howell and others that global liquidity as a driver of Bitcoin long-term prices also demonstrates Granger causality. In fact Howell found a power law relationship between Bitcoin prices and the Crossborder Capital GLI global liquidity index that is very steep, nearly the tenth power, k = 9.72,, and with a high R^2 = 0.90 correlation coefficient. Howell and other, using various measures, suggest that global liquidity leads Bitcoin prices by around 11 to 13 weeks.
The Howell data spanned Bitcoin prices from around $200 to $100K. I wanted to check the liquidity correlation over a broader price span and have thus done my own regression. I do not have access to GLI data so have used the OECD M3 monetary data for the 38 member countries of the OECD, which I downloaded from the Federal Reserve’s FRED data base and which runs through October 2024. These are all ‘developed’ countries, so noticeably China and India are missing from the data. While Howell’s GLI index is quite complete including coverage of liquidity in the commercial banking sector and other non-governmental liquidity sources, we are still able to demonstrate a strong correlation over a long period of time with OECD M3 monetary supply data.
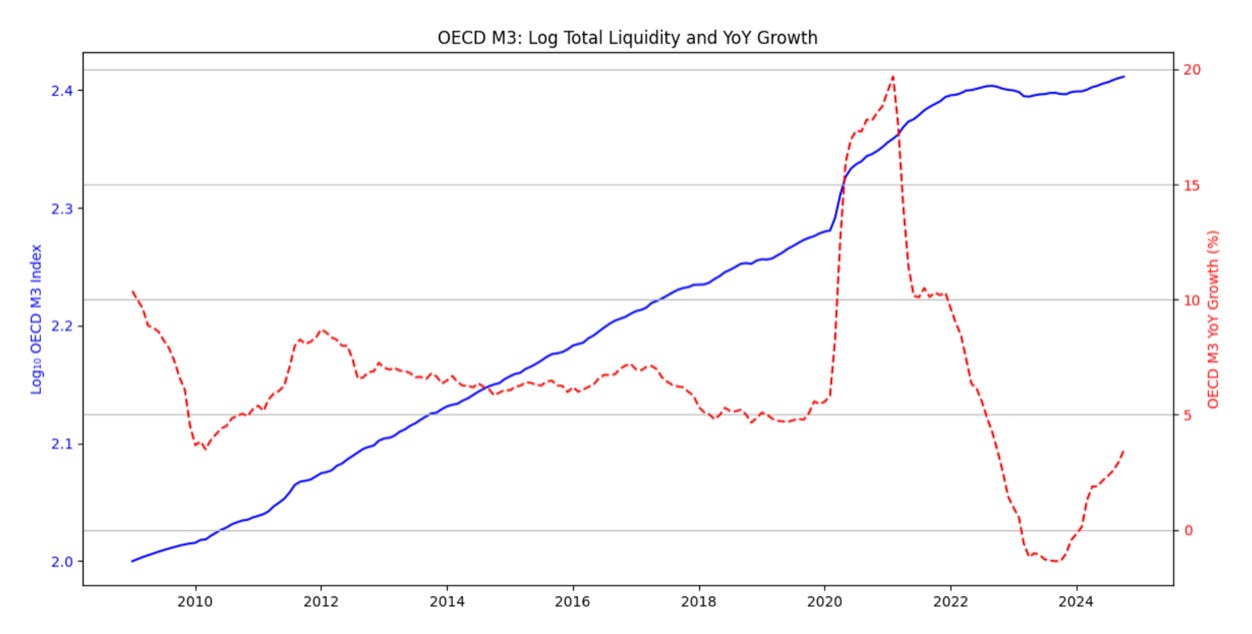
I downloaded the OECD M3 growth rates, available on a per month basis, from Bitcoin’s genesis in January 2009 through October 2024. The monthly data are percentage year-over-year growth rates, and I also reconstructed a total liquidity index normalized to 100 at January 2009 from those. The growth rates are shown as the red dashed line, and the index as the solid blue line, in Figure 1.
There are three notable peaks following the 2009 downslope from over 10% during the Great Financial Crisis of 2008. The peak values are 8.7%, 7.2%, and 19.68% respectively and occurred in January 2012, December 2016, and February 2021. Each of these preceded one of Bitcoin’s 3 major bubble peaks occurring roughly 4 years apart. The 2008 peak not shown, except by the 2009 downslope, preceded the smaller bubble of 2011.
Price discovery for Bitcoin got going in 2010 and with data through late 2024, our Bitcoin price range has a 6 order of magnitude range, an over 3 orders of magnitude broader range than Howell’s regression of Bitcoin vs. the GLI index.
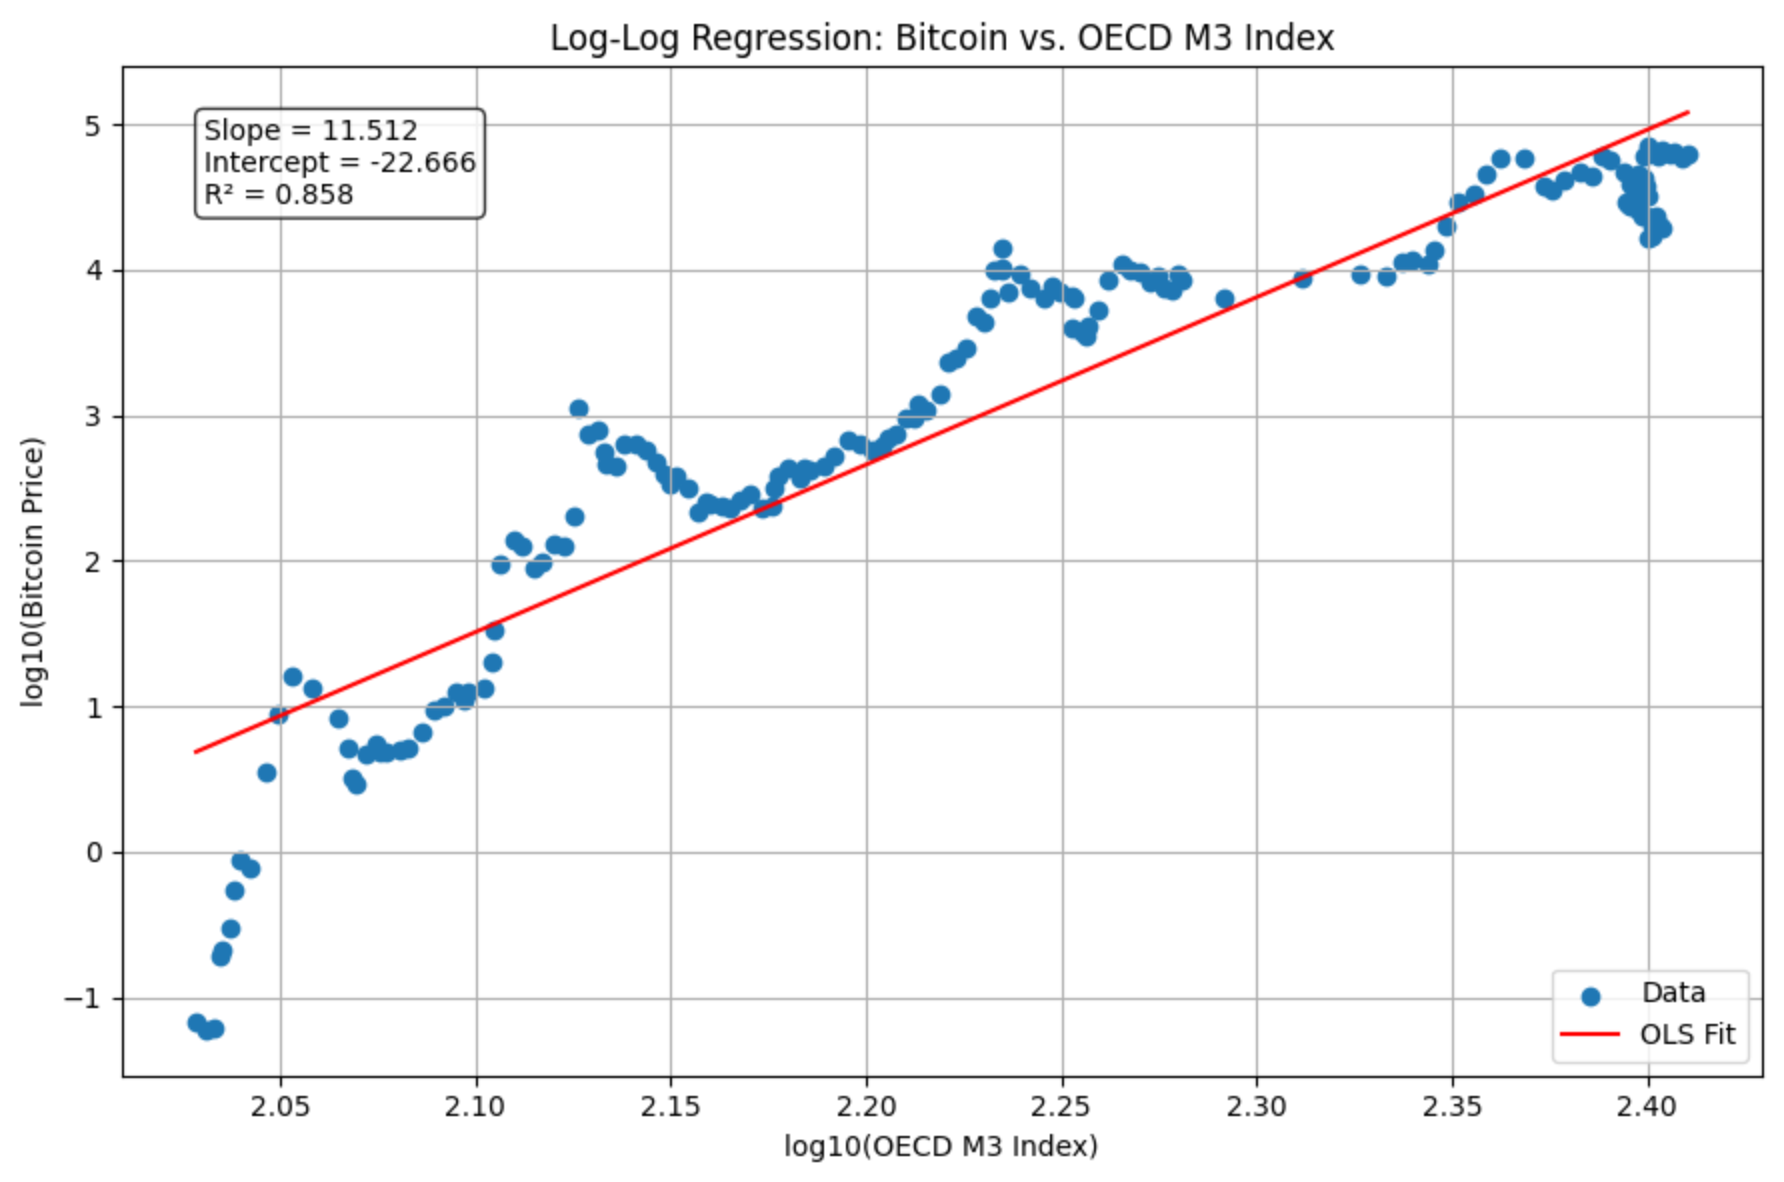
Figure 2 shows the regression of log10 of Bitcoin price against log10 of the OECD M3 index that I constructed from the growth rate data. From above $1 to $100K the fit looks rather good. The OECD M3 index has a dynamic range of a multiplicative factor of 2.5.
The slope (power law index) is even steeper, at 11.5, than Howell’s GLI regression found. The R^2 is 0.86, quite decent, despite covering a much broader range in both time and Bitcoin price.
High liquidity growth prior to bubbles
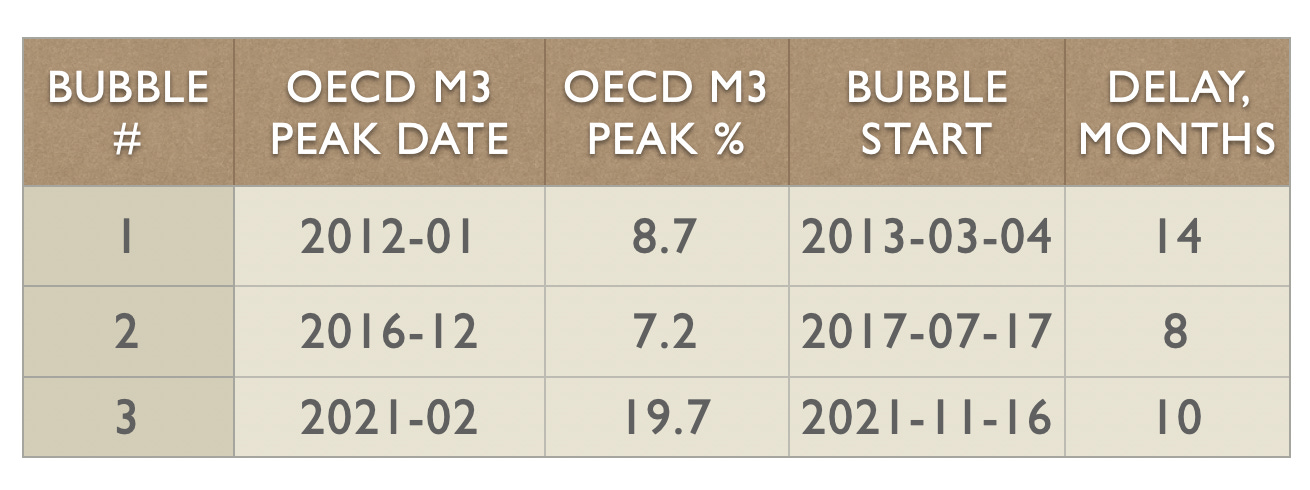
Table 1 looks at the major 3 bubbles of 2013, 2017, and 2021 (peak dates). The prior M3 peak dates were around 11 months’ earlier, give or take 3 months. In all cases the peak M3 year over year growth was 7% or so higher, this is possibly a trigger condition for a bubble.
The latest available OECD M3 growth rate as of October was 3.4% and we know that it was increasing in the range of 0.4% and 0.5% per month for a few months prior. Projecting forward to now, April 2025 we still would not expect the YoY growth to exceed about 6%. And it has required 7% growth to trigger bubble starts nearly a year later.
We may not see the next bubble start until the spring of 2026 or later, it would require a very strong jump in liquidity according to he historical record summarized in Figure 1 and Table 1.
Granger causality?
Next, I looked at whether the OECD M3 liquidity index demonstrates Granger causality with Bitcoin and with what lead time. Howell has demonstrated Granger causality of about 11 to 13 weeks lead for his GLI index relative to Bitcoin’s price response.
Granger causality is a test for whether an index or price series has predictive (‘causative’) value for another price series. It is not strictly causality but is widely used in economics and finance as well as in neuroscience, climate studies, and other disciplines. It basically asks if by adding information from a second index one can improve the statistical forecasting accuracy over and above what one would get from projecting the first index values alone. It is not “does X cause Y” but does “X help forecast Y”. And the causative variable has to precede the resultant variable by some time interval, X has to lead Y, Y lags X.
The Granger test yields p-values, and a low p-value less than 0.05 says the apparent predictive improvement is unlikely to be due to chance to a reasonable 95% confidence.
We analyzed the Granger causality between the YoY changes in the OECD M3 liquidity index and Bitcoin log10 residuals divided into three zones: the lowest 40% are the Core power law zone, the middle 20% of residuals define the Transition zone between the core and bubbles, and the top 40% correspond to the Bubble zone.
Only the orange line, the Transition zone, approaches the p = 0.05 level, with a minimum value of p = 0.065 at 6 months’ lag. The bubble zone line is far away and the core zone dips down at around 8 months’ lag but does not fall below p = 0.25.

Summary and conclusions
It appears from Table 1 that major Bitcoin bubbles can occur around 8 to 14 months after peak annual changes in OECD M3 liquidity exceeding 7%. We have not reached that level of OECD M3 liquidity growth based on reasonable extrapolation of the data from October 2024, so it may be that the next bubble start is not in 2025.
The supposed 4-year cycle for bubbles is not a given since we only have three major bubbles adhering to this possible rhythm. The 4-year cycle was originally predicated on the influence of Halvings and those have become less and less important now that inflation in Bitcoin supply is under 1% and 95% of the ultimate Bitcoin supply is already minted.
The overall global liquidity cycle, according to Michael Howell, is a reflection of a longer refinancing cycle that has an approximate periodicity of about 65 months, just under 5 and 1/2 years. However, conditions in the money markets and bond markets are deteriorating, and a sufficiently serious crisis could provoke a strong liquidity response from monetary authorities that could bring a Bitcoin bubble forward in time.
Maybe the US Strategic Bitcoin Reserve buying begins in earnest, that would be a form of liquidity creation, since the plan is to revalue Treasury gold holdings upward and use the “paper gains” as a source of funds. That would be liquidity to the tune of perhaps 200,000 BTC x $100K or $20 billion in the first year (if no large bubble); that is still not a large number relative to the total Bitcoin market cap.
It appears from Figure 3 that liquidity is marginally Granger causal at around 6 months of lag from the changes in OECD M3 liquidity. But the M3 changes only influence the Transition zone behavior of Bitcoin, not the other zones. Currently Bitcoin is in the transition zone, very near fair value for a median QR regression.
The takeaways from this and the strong and steep power law relationship of Bitcoin price vs. OECD M3 liquidity are as follows:
Liquidity supports Bitcoin’s long term growth.
Steep changes in liquidity help to trigger bubbles but do not appear to be sufficient to sustain large price rises in bubbles.
We are not yet at the 7% year-over-year level that would typically trigger a bubble.
Once a bubble gets triggered, other factors such as momentum trading and FOMO excitement come into play and attract speculative capital.
Bitcoin owners look forward to more incoming liquidity in 2025, and especially liquidity growth exceeding 7% annual. The US M2 growth YoY is currently around 4% (The US M3 series has been discontinued by FRED).
Great foresight, Stephen, for using M3 as a liquidity proxy in absence of Howell's GLI data, M2 is limited for this purpose. The peak of Hurst exponent was last year, 2024 October, according to your calculation with Bitcoin bubble peak likely to occur Q4 2025. The liquidity is however pointing to first half of 2026 as the bubble peak, if all else equal. How do you reconcile these scenario?
Such a great post!
thanks for that!!!!