

When $1 Million?
Not 2025, After 2030

Cathy Wood view
Cathy Wood said post-election on CNBC that Bitcoin will reach $650,000 in 2030 as the base case and her bull case is $1 to $1.5 million for that same year. Power law quantile regressions say there is only about a 20% chance of her base case coming to pass by 2030, and the bull case of $1 million has less than a 5% chance by that date. The 50% probability implied by quantile regression of the price history corresponds to the beginning of 2034.
Spreadsheet-based forecasts are not a match for the consistency of the power law across Bitcoin’s entire price history. It has been adhering successfully to power law behavior for a decade.
There is nothing in the price history that suggests $1 million will happen in the 2020s. Based on these regressions, which clearly display power law behavior, it will occur by 2032 (25% probability) or later. There is only somewhat more than a 10% chance of Bitcoin reaching that level during 2031.
$1 Million in 2025?
It is also clear from price behavior that the volatility of Bitcoin has been decreasing with time. This is indeed expected for a power law behavior of price. While over the full series the standard deviation is about 0.31 in the log10 (a multiplicative factor of two) it has decreased by the fourth Epoch to around 0.24 (a multiplicative factor of 1.7).
There are a number of exponentialists promoting Bitcoin reaching $1 million this year, based on various narratives. Bitcoin has survived many narratives, positive and negative, and yet has persisted in power law behavior along with exponential bubbles that rise to about two standard deviations (2 σ) maximum and then fall back to long-term power law support at one standard deviation (1 σ) below trend.
To reach $1 million in 2025 would require a bubble excursion of 1.0 in the log, a multiplicative factor of 10 from the present price, and in log terms that is 1/0.24, which is greater than four standard deviations (> 4 σ). Throughout Bitcoin’s price history we have not seen this even once, nor have we seen 3 σ, and prices have stayed overwhelmingly in the range of -1 σ on the downside and +2 σ maximum on the upside.
Bitcoin is a meta-network, a collection of networks, and network feedback effects appear to modulate the behavior back toward the long-term trend. And whales have consistently taken some profits at extreme highs.
Quantile regressions corrected for auto-correlation
Figure 1 below shows a quantile regression of Bitcoin’s weekly price history including AR(2) correction for auto-correlation. The AR(2) addition to the model results in Durbin-Watson statistics quite close to 2, indicating auto-correlation has been well accounted for.
The quantiles are at probability levels of 0.05, 0.10, 0.25, 0.5, 0.75, 0.9, 0.95 and the figure displays also the seven equations corresponding to those levels. These can be used to calculate probabilities for when the price could reach a given level of $300K, or $1, $3, or $10 million, or any level one might be interested in. The years (to the nearest tenth of a year) when a certain price might be reached, given a certain probability threshold, have been calculated using the seven equations and are shown in Table 1.
For example, at the $1 million level the quantile regression indicates that there is only 10% probability that the price will not be reached by 2036.1, and there is a 25% it will not be reached by 2035.2 . There is an 80% chance, looking at both the 0.1 and 0.9 levels, that it will be reached between 2031.8 and 2036.1 (a 10% chance later than that range, and a 10% chance sooner).


Probability curves for price levels
Figure 2 below shows the probability curves for each of the four considered price levels. The percentage chance of reaching the price increases with time and the x-axis has the probability running from right to left (the scale is not linear). The probability is one minus the quantile level shown in the table and in Figure 1 (quantile 0.95 is only exceeded 5% of the time).
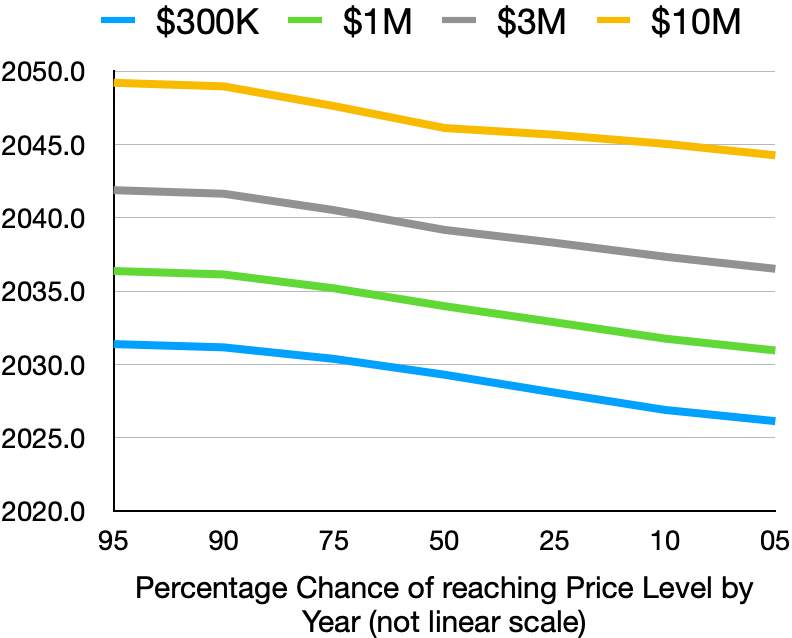
The chances are greater than 75% of reaching $300K by 2030 and it could be reached early next year or at the end of this year with less than 5% probability. The chances are greater than 75% of reaching $1 million by 2035, $3 million by 2040 mid-year and $10 million by late 2047.
About 80% of the probability space lies within a four year range for each price objective, with roughly two years on either side of the main trend, the quantile 0.5 or median level. About 50% of the probability space lies with a two year range.
Effect of quasi-periodic bubbles
The effect of bubbles is implicitly included with these quantile regressions, but not the bubble timing. We have seen that peaks occur in quasi-periodic fashion approximately every 4 years, including late 2013, late 2017, and a double peak in 2021. There is wide expectation for another bubble in 2025.
A bubble could accelerate the timings, but by the same token, another Bitcoin winter post-bubble bust could delay them.
If bubbles stay on the four year pattern, then 2029 and 2033 would have bubble peaks and inspecting Table 1, it would be reasonable to consider that $300K could be reached before 2029 with greater than 50% probability and $1 million could be reached a year or so sooner than the 2034 indication with 50% probability.
And if the table shows a trough year (which on the four-year pattern would be 2026, 2030, 2034 etc.) there could be a delay of a year or more in achieving a given target price level.
Summary
In summary, continuation of these quantile regressions suggest a price level of $300K in early 2029 plus or minus 2 years, $1 million at the start of 2034 plus or minus 2 years, $3 million early 2039 plus or minus 2 years, and $10 million at the start of 2046 minus a year or plus 3 years. The estimates are somewhat conservative since the bubbles are included for in terms of their overall effect on the quantile regression levels, in particular at 0.75 and above, but the timing of these is not directly considered.
A $300,000 Bitcoin price attainment in 2025 seems a stretch, but if we get an excursion above 0.97 in quantile terms and the bubble does not pop before year-end, it’s a possibility.
Thanks for this analysis, Stephen. The underlying assumption implicit in these price projections is that the system of supply and demand that has been driving Bitcoin’s price evolution over the last 14 years continues and no new, independent forces impact the system. It seems to me that the price evolution so far has been driven by global individual adoption growing proportional to time to the third power and market cap growing proportional to users squared. It’s not clear to me whether the introduction of large institutional investors like hedge funds and insurance companies; corporations like MicroStrategy and Semler Scientific; and nation states like Russia and the US represent a continuation of the individual adoption driver, somehow pre-ordained to enter the system at this moment, or if they constitute a new driver entering the system. If the latter, it seems likely that the demands of the new, large entities will add to the initial power law price trajectory, driving price higher.