Difficulty definition
It is certainly of interest if one can find some intrinsic feature of the Bitcoin network that is predictive of price. In this article we examine whether the difficulty adjustments, which are a proxy for the hashrate, can be shown to lead the price behavior.
The difficulty is adjusted each 2016 blocks, approximately every two weeks, based on how fast the blocks were completed on average during the interval. This makes the difficulty proportional to the average hashrate since more hash power leads to winning blocks more quickly.
In order to keep block times uniform and avoid very fast blocks that would destroy the global synchronicity of the Bitcoin timechain-based network, Satoshi introduced the difficulty adjustment. It keeps pushing the new block times back toward 10 minutes on average by determining how hard it is to win the Bitcoin winner take all lottery for each block.
As more and more machines enter the network and as systems get faster (and this has happened at faster than Moore’s Law rates), a difficulty adjustment is absolutely essential. It is one of the most inspired design features that Satoshi included in Bitcoin’s consensus algorithm.

From 2013 on
In the first four years of Bitcoin mining there were several quantum leaps in hashing performance due to changes in the predominant chip architecture used for hashing. Bitcoin mining began with CPUs, then moved to more optimal GPUs. There was some usage of FPGAs as well, but by 2013 the switch to highly customized ASICs was well underway.
The latest ASICs are literally hundreds of thousands of times faster per chip than current generation GPUs at solving the dual SHA-256 hashing problem that consists of around 1600 mostly bit-level operations.
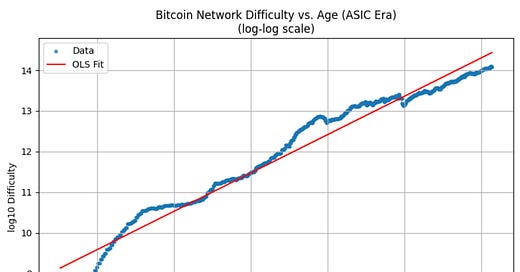
There were huge performance jumps as the predominant chip architectures were replaced, and for this reason, I only consider difficulty data and correlations from mid-2013 on. Figure 1 above is a log-log chart of difficulty vs. Bitcoin age, starting from July 2013 until May 2025. It’s a power law in general, roughly a straight line on the chart, with difficulty rising as the 9.5 power of Bitcoin age. There may be some flattening in the past few years.
Correlation

Now for a first look at the relationship between difficulty and price we want to reduce each to their respective residuals or relative changes. For difficulty we simply take the ratio of the new difficulty at each approximately two week adjustment period, relative to the old value. On average difficulty is increasing so the value of the adjustment ratio is greater than 1.0 in most, but not all, cases.
For the price the residuals are defined by subtracting the power law, which defines the overall long term trend. This is a power law of age since Bitcoin’s Genesis block and has a power law index of 5.69, and an R2 of 0.96. The residuals are defined in log space as the differences between the log10 of the actual price and the log10 predicted price from the power law trend.
We then took the correlation between these two quantities, using data at each difficulty adjustment period since mid-2013. The graph in Figure 2 above is for positive price residuals, delineating the bubble zone, that is the more interesting domain. These residuals are on the y-axis and the difficulty adjustment ratios range from below 0.9 to above 1.4 on the x-axis. These are color coded by different bands of the difficulty adjustment. There is also evidence of a positive correlation and indeed the measured correlation between all of the price residuals and difficulty adjustment including both the bubble and core zones is 0.40.
Granger Causality
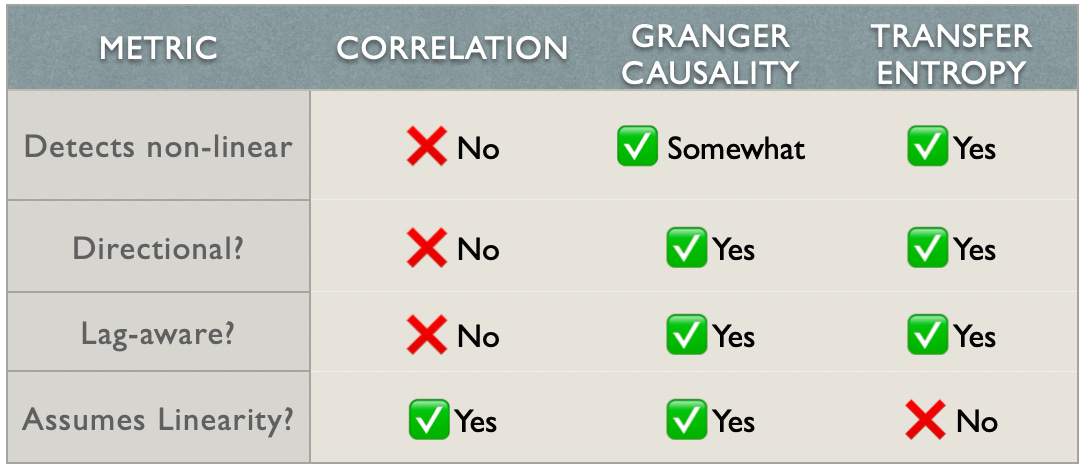
Granger causality tests whether one series has predictive value for another series. One can test for different leads or lags between the two time series.
In this case we are testing whether the price residuals lead the difficulty adjustment or whether the opposite, for all difficulty adjustments in the 12 year period. Low values, below p = 0.05 (note y-axis is logarithmic) are considered significant. Here in Figure 4, we separately plot the p-values for the bubble zone (red, positive residuals) and core zone (green). In the core zone, we see significant values below the horizontal dashed line for 2 to 8 week lags, with the highest significance (lowest point) at 4 weeks.

This is shown in Figure 3 above, with the most favorable lags at 4 to 6 weeks (difficulty lagging price).
However, the situation is surprisingly reversed when we test for difficulty leading price. Figure 4 shows the Granger causality results for the difficulty adjustment ratios leading the price residuals by 2, 4, 6, or 8 weeks.

In the bubble zone, difficulty appears Granger causal for price with a lag (of price) centered at 4 weeks. This suggests that miners may be picking up some market signals and increasing their hashing activity in anticipation of higher prices. Perhaps they are monitoring global liquidity or other possible signals. We know that liquidity leads Bitcoin prices by something like 10 to 13 weeks, according to studies by Michael Howell, Giovanni Santostasi, myself, and others. The lead is especially relevant in the transition zone as one is moving from core to bubble phases.
Cross-correlation function with lags

Another test one can make is to look at the cross-correlation function with lags. I have evaluated this for the bubble zone only, with either price or difficulty leading (positive values on x-axis) and the results are shown in Figure 5. The highest correlations are with difficulty leading, especially for 9 to 12 week ahead of price residuals. The gray shading is the result of running 1000 randomized shuffles of the difficulty values. The highest observed correlation values are five times larger than the random expectation at the 95% confidence level.
Transfer Entropy

Another method to examine for statistically significant leads and lags is known as transfer entropy. It relaxes the assumption of linearity. It is a relatively new technique that does not look at correlations or regression coefficients and also handles non-Gaussian distributions better than does the Granger causality method. The method asks, how much better can you predict y going forward, using the history of x and y both, rather than using only the y history (here y is the series of price residuals, x is difficulty adjustments).
We evaluated the transfer entropy for price residuals lagging difficulty adjustments by up to 8 weeks. For the core zone the values were small, of no consequence. But in the bubble zone, the transfer entropy values were close to 0.06, and of significance. The peak value was for difficulty leading price occurs at 6 weeks, roughly consistent with the Granger causality analysis.

Summary for 2013 - May 2025 inclusive
The three methods agree with the conclusion that difficulty leads price in bubbles. The Granger causality is stronger at 4 weeks and the transfer entropy at 6 weeks. The cross-correlation method, less robust, shows a peak at 10 weeks but rather similar results at 4 to 6 weeks also.
It’s a striking and somewhat counter-intuitive result for such a significant lead by difficulty and for it to hold up well in similar fashion with similar strengths and lead times for all three tests.
What has difficulty done for us lately?
But we want to know if this behavior is persisting. Thus I have redone the analyses using only the past 5 years’ worth of data, with the same cross-correlation, Granger causality, and transfer entropy techniques.
The results are much less striking.

First off, we note the recent flattening in the curve of Figure 1. The difficulty growth for the past 5 years can be fit by a power law of index 6.28 (standard error 0.09), lower than the 9.45 seen with the full data set. So there is evidence of flattening in the growth of difficulty.
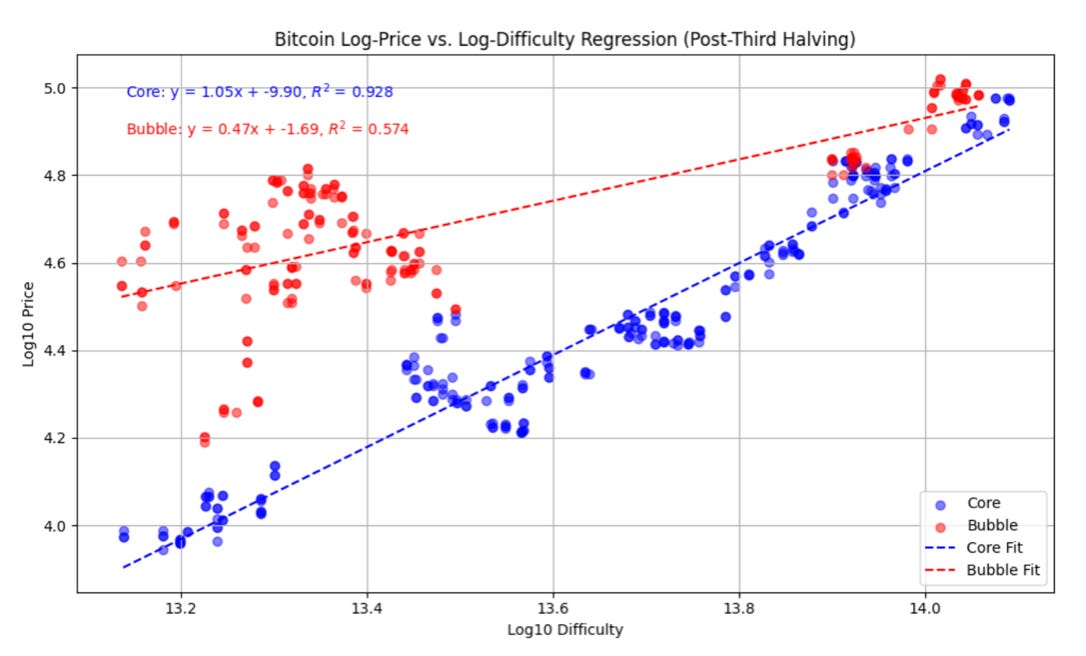
If we break down the regressions against price independently for the bubble zone and core zone we find a power law index of 1.05 (0.47) between price and difficulty in the core (bubble) respectively. The relationship is nearly linear for recent years in the power law core.

Since May 2020, the beginning of the interval, the maximum difficulty adjustment ratio is less than 1.1. Figures 8, 9, and 10 present the analyses for 5 years data for cross-correlation, Granger causality and transfer entropy, respectively.


The first two tests fail to show difficulty as leading price in the bubble zone (as was found for the full data set since 2013). Only the third test, transfer entropy, shows some significance for 5 years’ data in the bubble zone, somewhat lower than for the full data set, however still representing moderate influence.
We have to conclude that, on balance, difficulty leading price is not demonstrated in the bubble zone for the last 5 years.
Why would this be the case? Three possibilities come to mind: (1) not enough data to demonstrate a relationship, (2) significant decrease in difficulty adjustments with none above 1.1 as block times have become less volatile, and (3) lower price volatility in the bubbles and overall.
Mining companies have also become more sophisticated and diversified, and may be less likely to - when bubbles break and price is falling - to keep adding hashrate and driving up difficulty the way they did after the 2013 and 2017 bubbles. There was much less of this phenomenon seen in the downturn phase of the 2021 bubble.
Perhaps the effect will re-emerge if we have a substantial bubble in the next 12 months, we have to wait and see.


**Summary of the Article**
* **Period 2013-2025 (inclusive):**
* In "bubble periods" (when Bitcoin's price is above the long-term trend), *difficulty* leads Bitcoin price.
* Three different statistical tests reach the same conclusion:
* *Granger Causality* – difficulty leads by approximately 4-6 weeks.
* *Transfer Entropy* – peak influence about 6 weeks before price.
* *Cross-Correlation* – highest correlation when difficulty leads by 9-12 weeks (with an additional peak around 4-6 weeks).
* In the "core" regime (when the price is near the power law trend), the relationship is reversed: price leads difficulty by about 4 weeks.
* **The Last 5 Years (May 2020 - May 2025):**
* The growth rate of difficulty has moderated (Power Law index \~6.3 compared to \~9.5 previously).
* Most difficulty adjustments were small (ratio < 1.1), weakening the statistical signal.
* *Cross-Correlation* and *Granger Causality* do not show significant leading behavior of difficulty over price.
* *Transfer Entropy* indicates only moderate influence, peaking at around 3 weeks, without strong statistical significance.
* **Main Conclusion:**
* Over most of the past decade, especially during bubble periods, difficulty adjustments provided an early signal for Bitcoin price increases by several weeks.
* In recent years, this relationship has significantly weakened; currently, difficulty is not a reliable indicator for upcoming price increases.
* It is possible that Bitcoin miners no longer increase activity ahead of market moves, or that the market has become more efficient and the signal has faded.
It would be nice if you could also make the article accessible to laypeople with the help of artificial intelligence.
I somehow manage to understand what you're saying but only after a lot of help from ChatGPT - the o3 thinking model.