Bitcoin’s Pre-Determined Disinflationary Monetary Policy
After 2024 Inflation is under 1% per annum, forever
(This was originally published on moneyordebt.com in Dec. 2019, before COVID-19 hit hard and before the Fed added $3 Trillion to the M2 Money Supply to take it from $15+ Trillion to $18+ Trillion in half a year)
The Federal Reserve Manages A Debt-Based Fiat Currency
The inflation in the M2 money supply in the US runs about 5% per year. In the last three years it has increased at a 5.0% rate, and in the past year at 6.0%. You may be surprised because you hear that the Federal Reserve is struggling to push inflation up to 2%. Well, that is for the particular core personal consumption price index that they prefer to follow. But the money supply can grow faster than price inflation because the population and productivity grow even while the monetary velocity (turnover rate) has been dropping in recent years.

Figure 1: M2 Money Stock, stlouisfed.org to Dec. 2019
[UPDATE: can you spot the change? and gray indicates recession]

Figure 1a: Updated M2 Money Stock through June, 2020
The Fed seeks to manage inflation and forward expectations for inflation with interest rates, open market operations, and quantitative easing. The Fed’s monetary policies are set by their seven-member Board of Governors, who meet eight times per year.
Now For Something Completely Different
Bitcoin is nothing like that. It has a predetermined monetary policy for the next century and beyond, with no committees of bankers and economists. It is designed as standard money, whereas fiat in various countries is managed by their central banks, and always with political constraints of some sort.

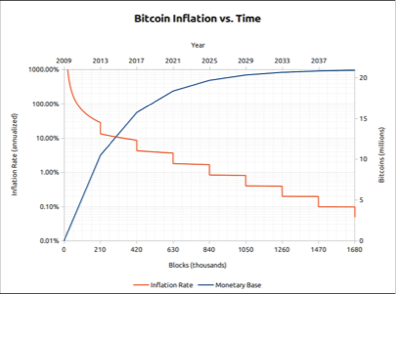
Figure 2. Bitcoin total supply shown in blue and inflation rate shown in orange stair steps down. The values for the orange curve are plotted in logarithmic fashion. Inflation drops below 1% at 840,000 blocks when Block Era 5 begins. http://bitcoinhub.co.za/wp-content/uploads/2016/01/Bitcoin-Inflation-logarithmic.png
Bitcoin is disinflationary, in fact once the lost coin rate exceeds the new coin rate, it will eventually actually become deflationary. Since it is designed to have a maximum number of Bitcoins ever created, namely 21 million, then it must be disinflationary and the Halving process does that. Currently, there are almost 18 million that has been created by the Bitcoin mining process on the blockchain, so 6/7 of the ultimate supply already exists. The creation of the next 3 million or so is on an ever-tightening emission schedule, which means an ever-tightening monetary policy.
After the beginning of the next century, there is no monetary policy at all, since the last whole Bitcoin will be very slowly minted from around the year 2102 until 2140. There is no policy going forward other than simply that of fixed supply. This is the hardest money ever created by mankind.

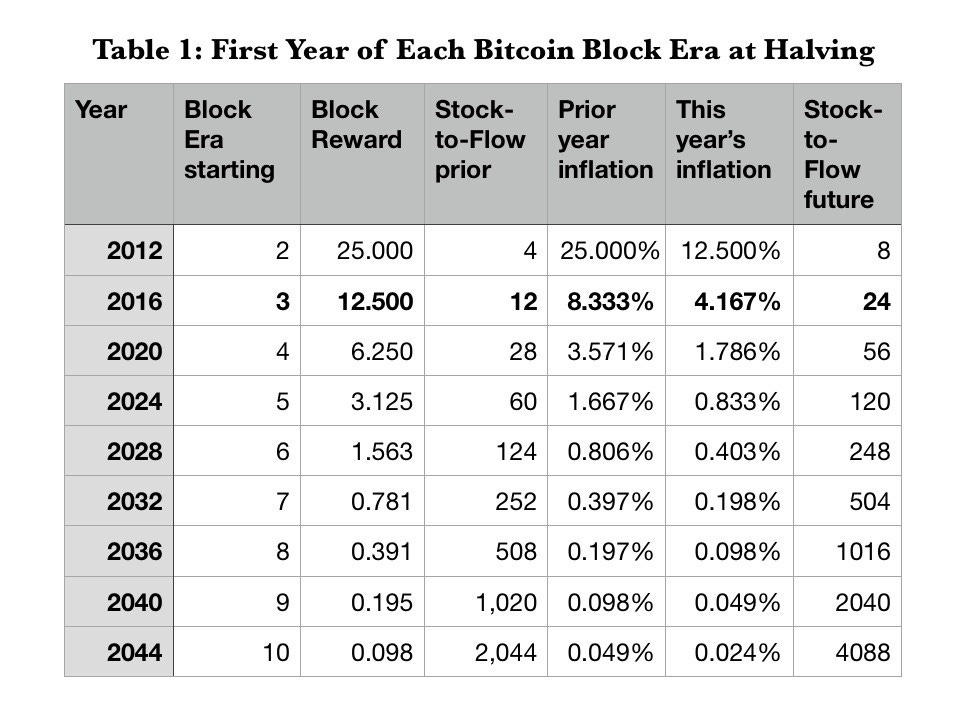
Table 1 shows, for the first year of each of the Block Eras 2 through 10 (we are now in Block Era 3), the mining reward, the Stock-to-Flow and inflation, both for the prior year, and for the coming year.
The dominant factor in the tightening of the Bitcoin monetary policy is the Halvings that occur every four Bitcoin years. And a secondary factor is the reduction in monetary inflation that would occur simply because the stock of Bitcoin is ever-growing until a century and two decades from now.
What Is A Bitcoin Year (Block Year)?
Bitcoin’s calendar has Block Eras, Block Years, Block Months and so forth, determined by the block count (block height) of Bitcoin’s blockchain. I have elaborated this calendar in the blog Living on Satoshi Time: What Block is it?
Each Halving occurs after 210,000 additional blocks have been created in the blockchain. Each Block Year is 52,500 blocks in duration, each Block Month is 1/12 that length or 4375 blocks. The Block Years vary somewhat from our Gregorian calendar years but recently differ only by about a week or two per year.
Bitcoin miners are rewarded by new coins if they are first to solve the cryptographic problem for the winning block. This is their main incentive (they also earn transaction fees), and it is known as the block reward. Each Bitcoin block is about 10 minutes long and there is a difficulty adjustment process every 2106 blocks (a Block Fortnight). This difficulty adjustment is designed to keep the block time in the vicinity of 10 minutes.
Since everything is pre-determined within the Nakomoto consensus, we can build out a table of past, present, and future monetary stock, supply rate, inflation, and stock-to-flow for Bitcoin. It is more natural if we work in Block time and then this can be translated to regular calendar time, exactly for the past, and estimated for the future.
Stock-to-Flow is the inverse of the inflation rate. It measures how many years it would take to double the money supply at the current rate of annual new supply emission.
Every block in the blockchain (time chain) is timestamped so that one can determine the correspondence to Gregorian calendar time in the past and extrapolate to calendar time for future blocks.
We are now in the third Block Era (third quadrennial period). The history of block rewards is that the reward was originally, from January 2009, set by Satoshi at 50 Bitcoins, then the first Halving cut that to 25 in November 2012 as the block count (block height) reached 210,000. And in July 2016 the second Halving cut the block reward at block 420,000 to its present value of 12.5 Bitcoins.
The block reward will drop to 6.25 at the third Halving expected to occur in mid-May, 2020 and in early 2024 the fourth Halving will drop the reward to 3.125 Bitcoins.
Table 1 illustrates how these successive Halvings drive inflation down very rapidly. Note that inflation is just the inverse of stock-to-flow (S2F). Inflation will be less than 1% from early 2024 as the fifth era begins and the S2F moves above 100. And it will be less than 0.1% from the eighth era beginning 2036, as the S2F exceeds 1000. Bitcoin is destined to be an inflation-free asset, an exceptionally stable currency, and the hardest form of money ever created.
The forward-looking S2F (last column of Table 1) can be calculated at the beginning of each new Block Era according to the formula S2F = 4 x (2^E — 2) and the prior S2F is one-half of that value. Each Block Year between Halvings, S2F increases by 1. So it is all calculable in advance. The only uncertainty is exactly how Block Year boundaries relate to our calendar years.
Buy Bitcoin, They Aren’t Making Any More After 2140*
*This is not investment advice.
You know the expression “Buy land, they aren’t making any more of it.” Although there is quite a lot of land on planet Earth, some 57.3 million square miles although 57% is uninhabitable desert or mountain land. The inhabitable area is 24.6 million square miles or almost 16 billion acres.
Bitcoin is rarer. There is less than 1 Bitcoin per square mile of habitable land (for reference there are 2.59 square kilometers per square mile).
There will be 32 Halvings of the Bitcoin supply rate in total, tapering the supply every four Block Years, until around the year 2140, when the total number maxes out at 21,000,000 Bitcoins. And then that is it, no more Bitcoins will ever be created. In fact, the last full Bitcoin will take an exceedingly long 38 calendar years to create (small fractions each year of course)! Even halfway out from now until mining ends, i.e. 60 years from now in the year 2079, we will be down to the last 100 Bitcoins ever to be created.
All gold in existence is some $8 trillion worth. For gold, the stock-to-flow (S2F) is around 54, since new mined supply rises at around 1.9% per year. Among precious metals, gold has the highest S2F, and this is a driver of value. The total market values for precious metals gold, silver, platinum and palladium adhere to a power-law relationship of S2F to the 5/3 power, based on an analysis by the anonymous PlanB.
For Bitcoin, the current inflation rate is about 3.7% and the S2F is 27, not yet as large as gold’s but headed toward being very much larger than gold. Next year there is a Halving that will occur on May 2020 and that will drive Bitcoin’s S2F to 56, about the same as that of gold, and that implies supply inflation of 1.8%, much lower than for the USD.
Bitcoin Price’s Power Law Trajectory
During its history, the Bitcoin price has climbed steeply as the blockchain has grown. We have fit a power-law relationship P ~ (Byr)^k where P is price, Byr is the number of elapsed Block years, and k is the power-law index.
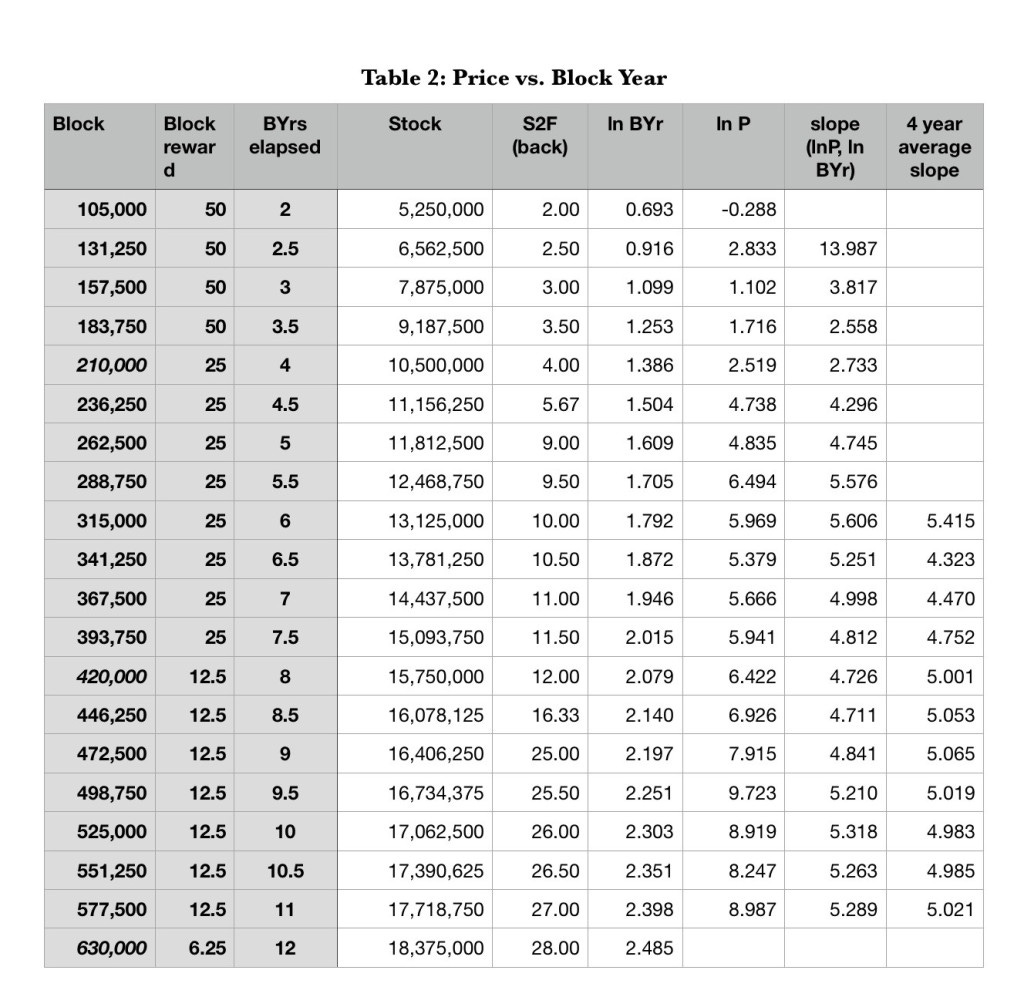
Table 2 uses Block year half-year price intervals from highcharts.com, at each 6 Block months. The next to last column shows the power-law index (slope in natural log-log space); it has been close to 5 for the last five years.
The slope or power-law index over the full range from Byr of 2 when prices started to be readily available until now is about 5.3.

Table 2 shows Block number, reward for that block, BYr or Block Years elapsed, the total outstanding supply at that block, the stock-to-flow for the prior year. The next two columns are the natural logarithm of the Block Year and the USD Price (from highcharts.com). The price roughly follows a power law in block number or Block year of the 5th power. The slope of the ln — ln relation, or power law index, is shown in the penultimate column. The four Block year average of the slope is shown in the final colum. The slope has been close to 5 since BlockYr 6.5. We are now close to 11.5 elapsed Block years.
In a future article, we will look at this in more detail and also look at the stock-to-flow model for Bitcoin price. That model, from PlanB (https://medium.com/@100trillionUSD/modeling-bitcoins-value-with-scarcity-91fa0fc03e25), indicates a steeper than cubic power-law relationship between price and S2F.
We would like to understand how much value comes from the stock-to-flow and how much comes from Bitcoin’s ever-increasing security. Our thesis is that Bitcoin follows a double feedback loop of increased security as the blockchain grows, leading to a higher prices, leading to higher hashrate, which increases security.
And increasing S2F means increased scarcity, and that also drives the price higher.
We also assert that it makes more sense to analyze price and other relationships in the fundamental temporal basis vector for Bitcoin, Block time. The fundamental driver is the lengthening of the blockchain; Bitcoin defines its own calendar. After analysis, one can then convert to the Gregorian calendar.
We argue that the price cannot rise with S2F for another decade or two in a power law fashion. S2F itself is already an exponential (!) with blockchain height, running as ~ 4 * 2^E in the limit, while E itself is simply int(B/210000) + 1. So the implication is for price rising as a power law of an exponential of Byr (or block count), which cannot persist for a very long time.
In fact, PlanB’s model has Bitcoin’s market cap rivaling that of all gold within 5 years. And then it goes on to quickly subsume the value of all currency in circulation by the subsequent halving.
What we would like to begin understanding is how Bitcoin’s market cap will flatten from a steep power law relationship with the Blockchain length, as its inflation drops to zero. Will it asymptote toward a stable, possibly very large, value? And will that value be comparable to all gold, or all base money in the world (around $20 trillion according to @crypto_voices tabulation), or something smaller or larger?
The first implies a Bitcoin price heading to $400,000 and the latter a price of $1 million.
What will drive investment flows into Bitcoin from traditional holdings? What will the market pay for ever-increasing scarcity and security, a harder currency than mankind has ever seen?
We don’t yet have the data we need, but we are on the most interesting ride into the future with Bitcoin.


