Bitcoin’s Not-so-Hidden Structure
Log-Periodic Modes improve both Structural Fit and Forecasting

Introduction: Yes there is Structure beyond the Power Law, but is it Ad Hoc?
It is self-evident with the bubbles and troughs around Bitcoin’s long term power law trajectory that there is additional structure to be explained. The question is: is it purely ad hoc and exogenous, entirely due to macro and market influences, or is there a strong endogenous component, as a consequence of the scale invariant nature of the network?
Recently Carlos Baquero and Raquel Menezes posted a preprint “Bitcoin’s Power Law: Weak Structure, Strong Forecasts” https://arxiv.org/pdf/2605.21316. They stated that they can explain Bitcoin’s price history more accurately with a set of three sigmoid functions corresponding to, as they infer, major adoption waves.
However, their model is entirely ad hoc, and requires 10 parameters. The Bitcoin power law requires only two. They also evaluated two other 10 parameter models: a polynomial fit and a cubic B-spline model, and make the same general claim, although their three sigmoid model is best of the group, with R2 of 0.97 vs. 0.96 for the power law, a standard deviation of 0.24 (rather than 0.30) in log10 price terms and a superior AIC of -19 vs. the power law’s 2528, very much improved (since smaller is better).
Essentially they say that Bitcoin possesses structural features that the power law model is not capturing, hence the title terminology “weak structure”. And yet, when they tested the ability of their sigmoid model to forecast Bitcoin it clearly failed, the power law performed much better, as they conclude in their paper.
This article shows that including log-periodic behavior also flips their structural conclusion, and does it with fewer parameters than their 10 parameter sigmoid, polynomial, and B-spline models. A power law plus a single log-periodic mode is statistically preferred by the price history.
And I show that adding log-periodicity to the power law improves forecasting for walk-forward models with a horizon of up to three years.
The central result is that the structure identified by Baquero and Menezes is real, but it is not best described by a sequence of logistic adoption waves. A power law plus a single log-periodic mode achieves a lower AIC with half the parameter count of the three sigmoid model, while additional harmonics improve the fit further. More importantly, the sigmoid model performs poorly in walk-forward forecasting, whereas log-periodic models improve predictive performance relative to a pure power law over horizons from six months to roughly three years.
Why Log-periodicity?
The log-periodicity addition to the Bitcoin power law is physically motivated. It is a natural consequence of continuous scale invariance (the power law) interacting with external influences on the network, and represents the endogenous discrete scale invariance (DSI) structure for Bitcoin.
While a sigmoid model assumes Bitcoin evolves through a finite sequence of independent primary adoption waves, a log-periodic model assumes Bitcoin is a scale-invariant network whose growth exhibits both continuous scale invariance (the power law) and discrete scale invariance (log-periodic oscillations in logarithmic time). The latter is not merely a statistical fit; it is a candidate dynamical description of the system.
I have presented evidence here: https://stephenperrenod.substack.com/p/bitcoin-vs-gold-and-the-geometry and here:
Disproving 4-Year Cycle Dominance in Minutes

Bitcoin commentators often speak as if the market is governed by a four-year cycle. The halving happens every four years, therefore the price cycle must be four years. It is simple, intuitive, and popular.
and here: https://stephenperrenod.substack.com/p/bitcoin-as-a-sandworm-ii-twist-dominance and in an additional 18 Substack articles dating from November 2025.
Bitcoin’s log-periodicity has been established by a number of techniques evaluating both Bitcoin vs. the dollar and Bitcoin vs. gold, and with methods including:
FFT
Lomb-Scargle periodogram
Wavelet scalogram
Timing of peaks
Timing of troughs
And regression fits to the full history of price residuals after removing the power law
The fundamental log-periodicity parameter has been repeatedly found to be in the range λ = 2.01 to 2.08 throughout these various tests.
My Fits of Sigmoids and Power Laws plus Log-periodicity
I fit 5 models, the power law, a three sigmoid model, and power law (PL) plus one or more log-periodic (LP) modes. In table 1, the LP1, LP2, LP3 indicate fundamental mode only, or one or two additional harmonics, respectively and K is the number of model parameters.
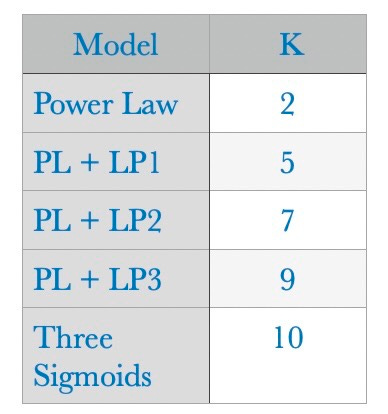
Figure 1 shows my best fit models to daily price history (Bitcoin vs. dollar) using power law (PL) only, three sigmoid functions, the power law with one fundamental log-periodicity mode, and fits adding one or two harmonics. Visually the red line of the PL plus log-periodic fundamental appears superior to the 3 sigmoids, especially early on, but we leave it to the detailed statistical evaluation for definitive determination. Adding harmonics improves the fits visually. For my triple sigmoid model the best fit inflection dates at ages 4.1, 8.29, and 12.0 years align with the build-up phases of three major bubbles.
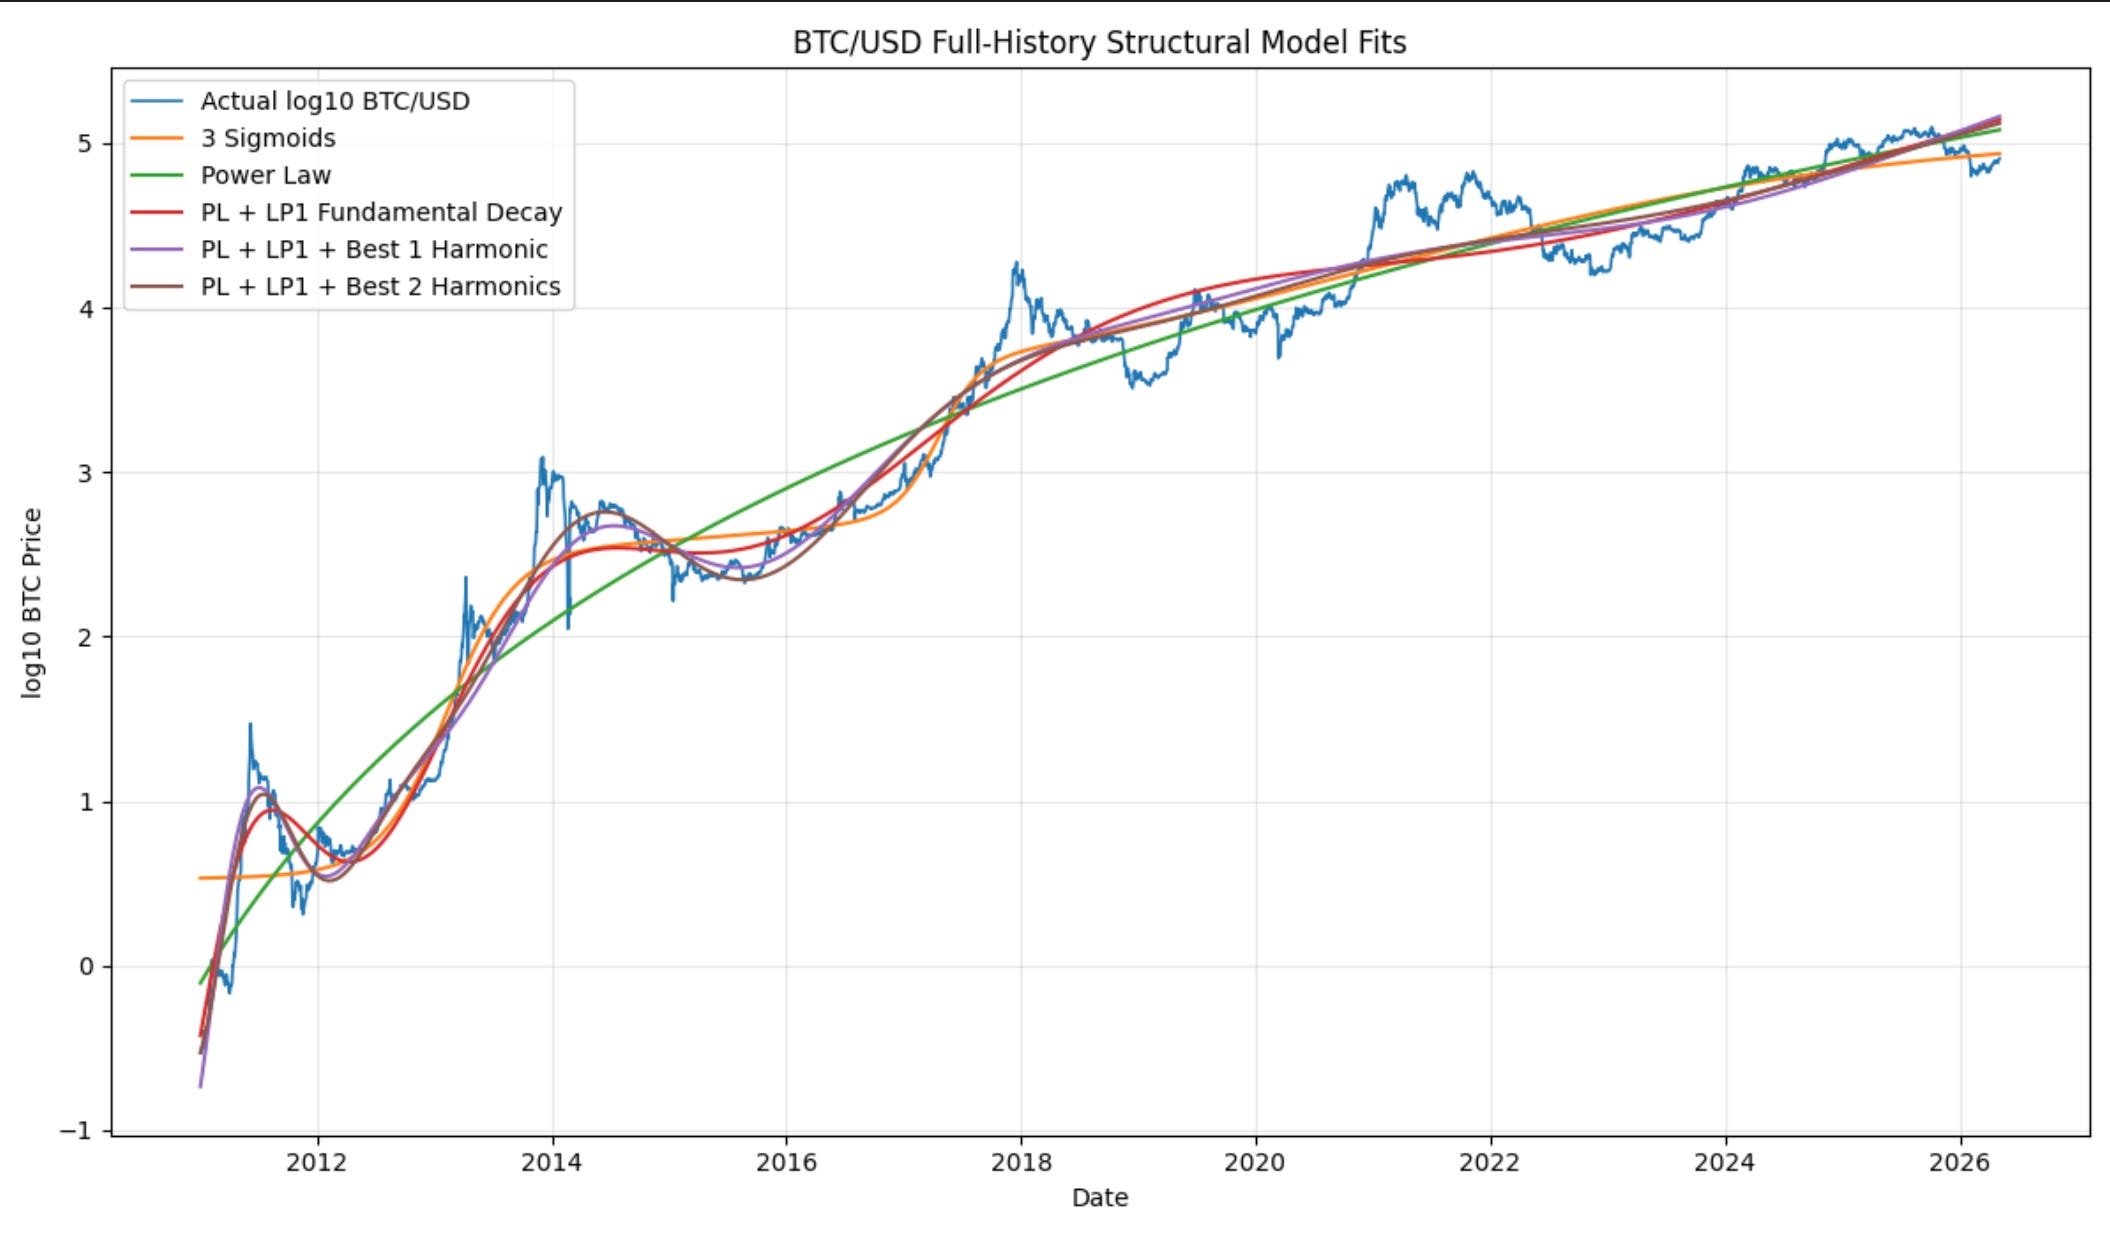
Figure 2 shows the RMSE (root mean square error) values for each of the five models and we see that the three sigmoid model does indeed outperform the power law only model, with a lower average error. However, once we add the fundamental log-periodicity we outperform the sigmoids, and the fits continue to improve when adding one or two harmonics.

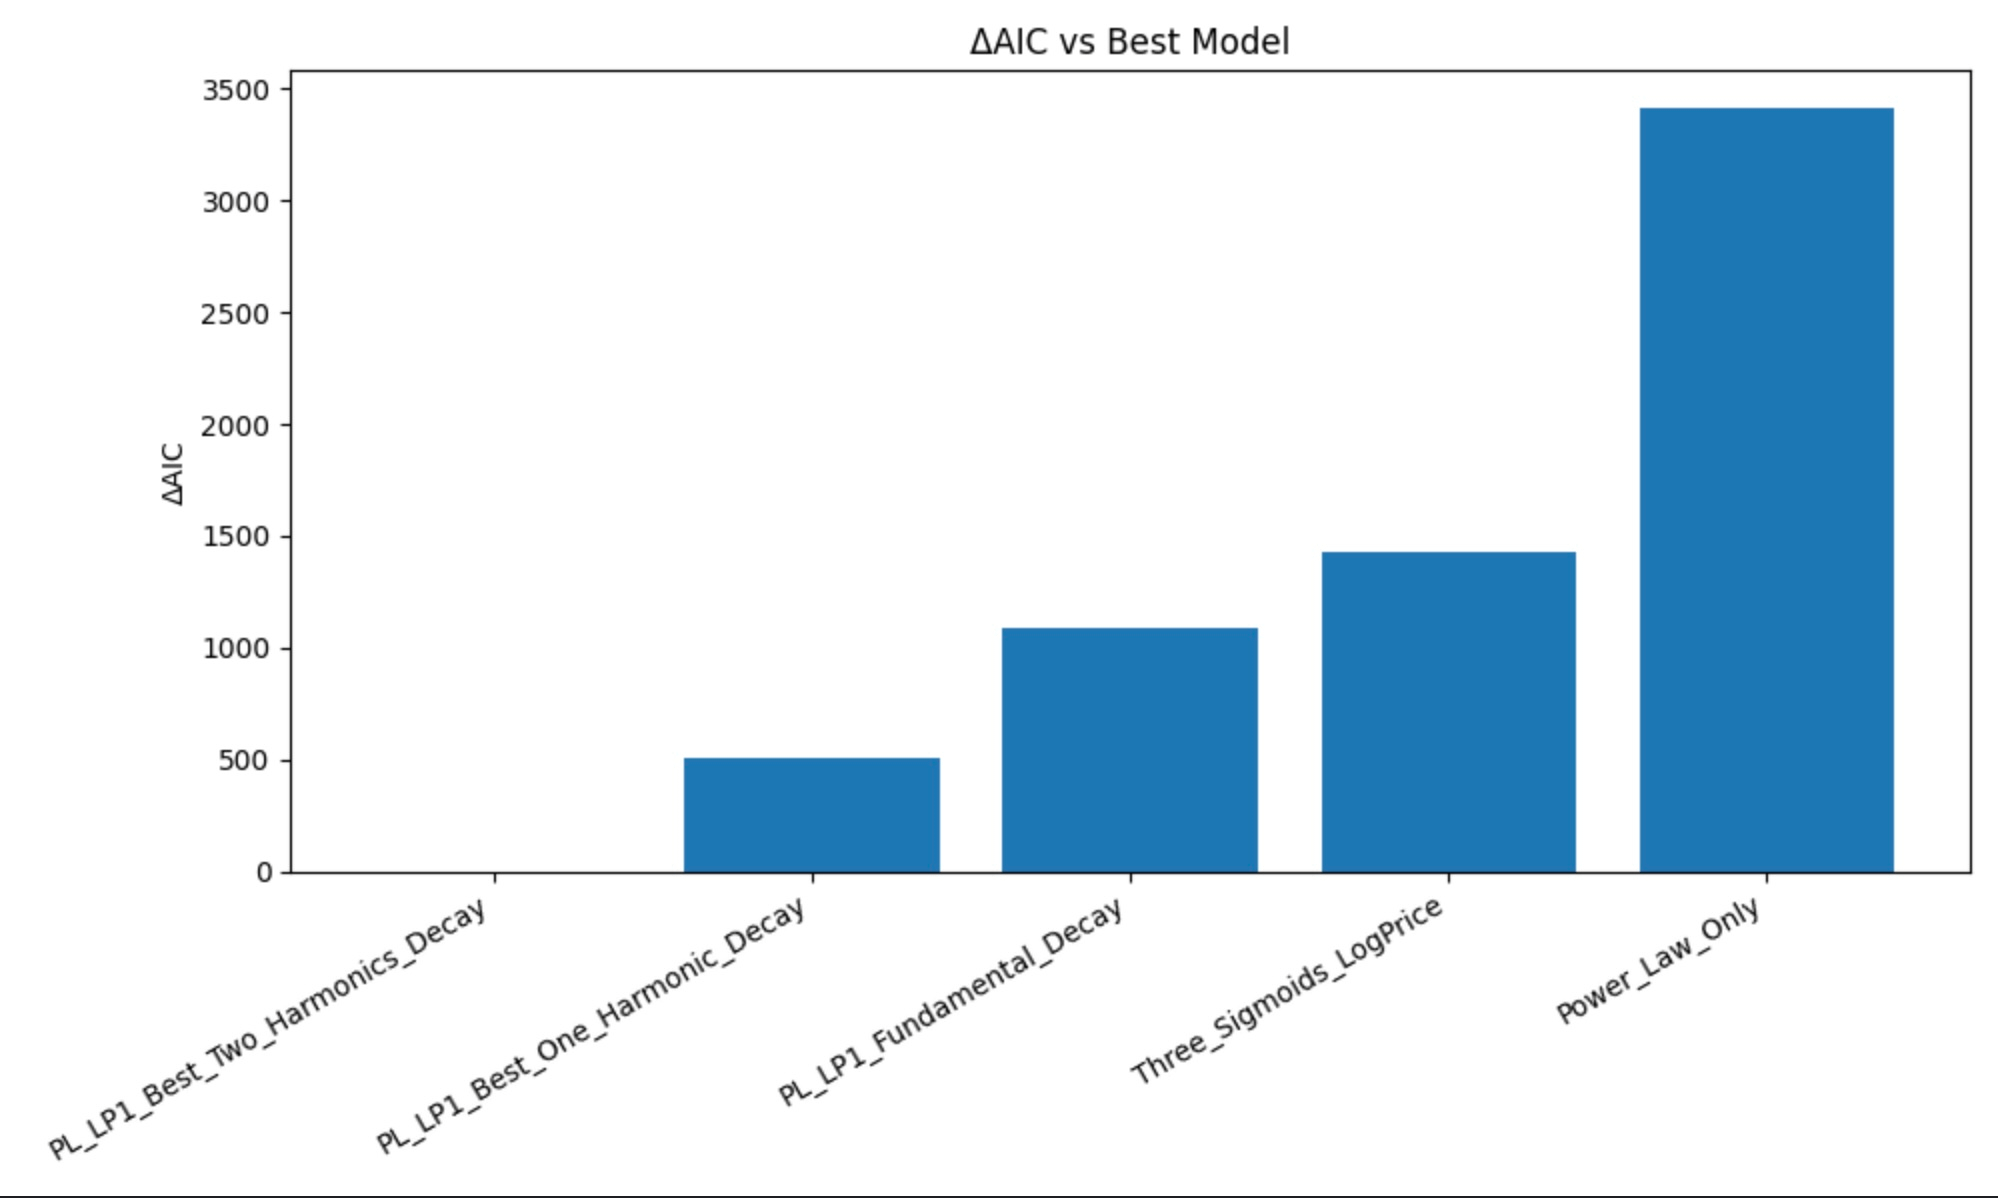
Figure 3 shows the significant superiority of the three sigmoids vs. power law only for the fit over price history, the differential is similar to that seen by Baquero and Menezes. However, once again, as we add log-periodic terms, the AIC of the power law plus log-periodic fits is superior to the three sigmoids, by as much as an overwhelming 1433 improvement in AIC (again, smaller is better).
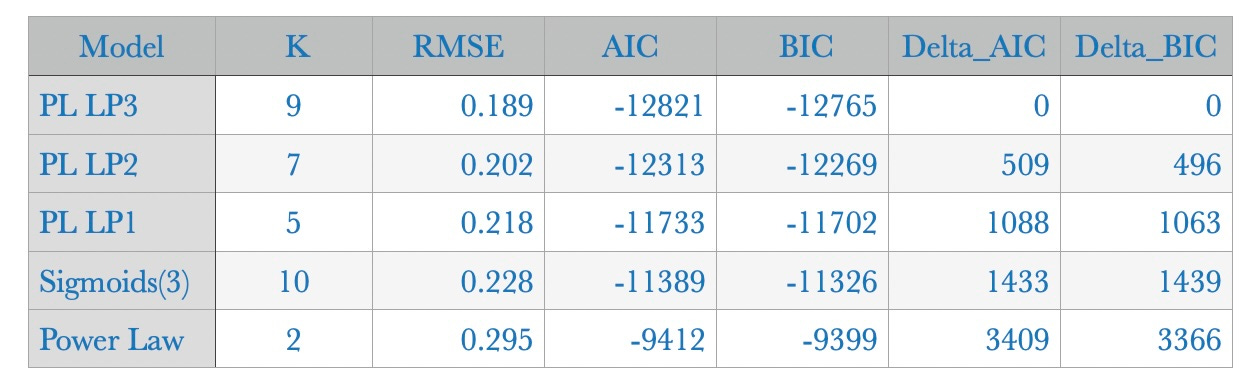
Table 2 shows the numbers represented in the bar charts for RMSE and AIC. It also shows K, the number of parameters for each model. The model designation is PL plus LP3 or LP2 or LP1 corresponding to the number of log-periodic modes (LP1 has fundamental only) and in each case the number of parameters is smaller than that for the three sigmoid model.
Inclusion of log-periodicity is able to lower the RMSE of the unexplained residual behavior from 0.3 to 0.2 or less in log price terms.
Our general assertion for the structure is that it is better explained by Bitcoin possessing a power law continuous scale invariance and also a log-periodicity reflecting discrete scale invariance. In fact we assert the two are coupled in a manner consistent with renormalization group theory.
Bitcoin adoption is not best modeled as a finite sequence of saturating logistic curves.
Instead:
* the process is recursively scale-structured, with a power law core and log-periodic oscillations
* it is oscillatory in logarithmic time, and from a physics perspective
* closer to renormalization/cascade dynamics than standard diffusion-adoption models.
Walk-Forward Forecasting
In walk-forward forecasting we consider only prior history at a given time, determine the best fit parameters for the model at that particular time in the past, and then compare its forward forecasting results (out-of-sample relative to the fitting procedure) with the actual observed Bitcoin price history.
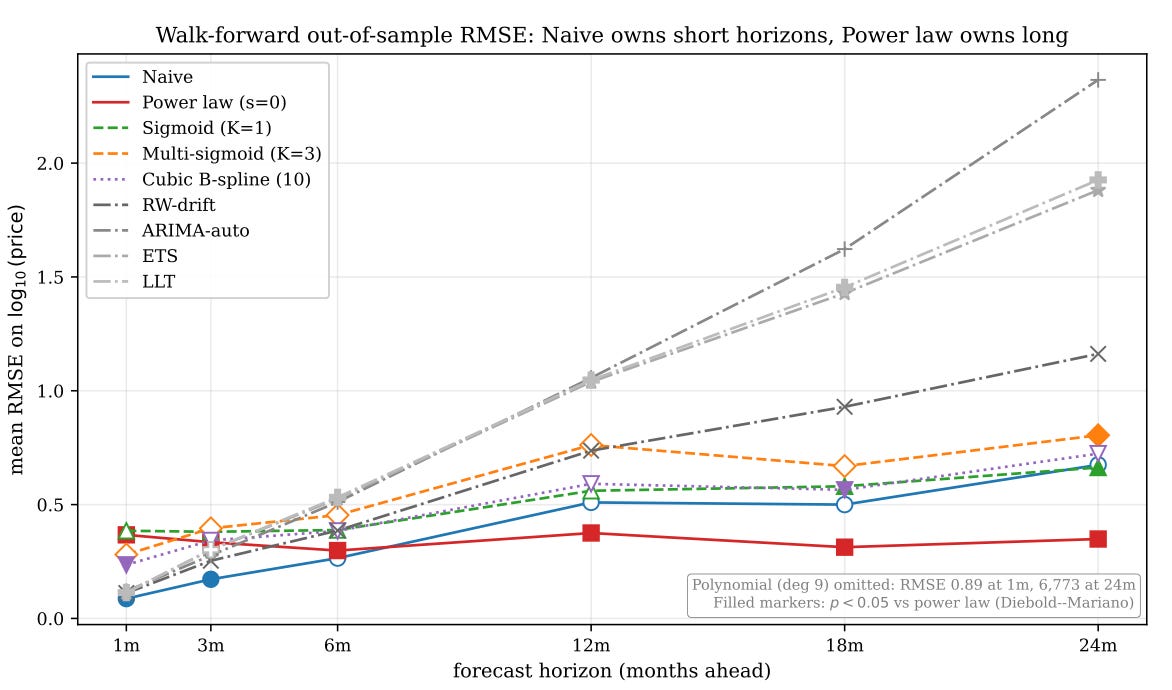
Figure 4 above is the walk--forward forecast of Baquero and Menezes, showing their out of sample RMSE values with horizons up to 24 months in duration. They found that a Naive model (tomorrow’s price equals today’s price) outperforms on average up to 6 months, there is a crossover at ~7 months after which the power law model (red solid line) is the best performing, with the lowest RMSE values. It outperforms a broad range of models, including the triple sigmoid (orange dashed line). It also has a flat curve, maintaining reasonable error up until 24 months.
I have performed a similar test, using 12 independent walk-forward origins from January 3, 2014 stepping a year at a time through January 3, 2025, thus ages 5 through 16 for Bitcoin. At each checkpoint I determined the best fit power law exponent and log-periodic spacing parameters β, λ for the power law model as well as associated amplitudes and phases for the log-periodic modes, only using data up until the checkpoint date, for each year in question. Where a harmonic was included the algorithm chose the best fit from among 4/3, 5/3 and 2 times the angular frequency of the fundamental, ω = 2 π / ln(λ) corresponding to the best fit λ for that series. Amplitude decay scaling as a reciprocal of age with offset δ = 2 years was used in two of the models with log-periodicity.
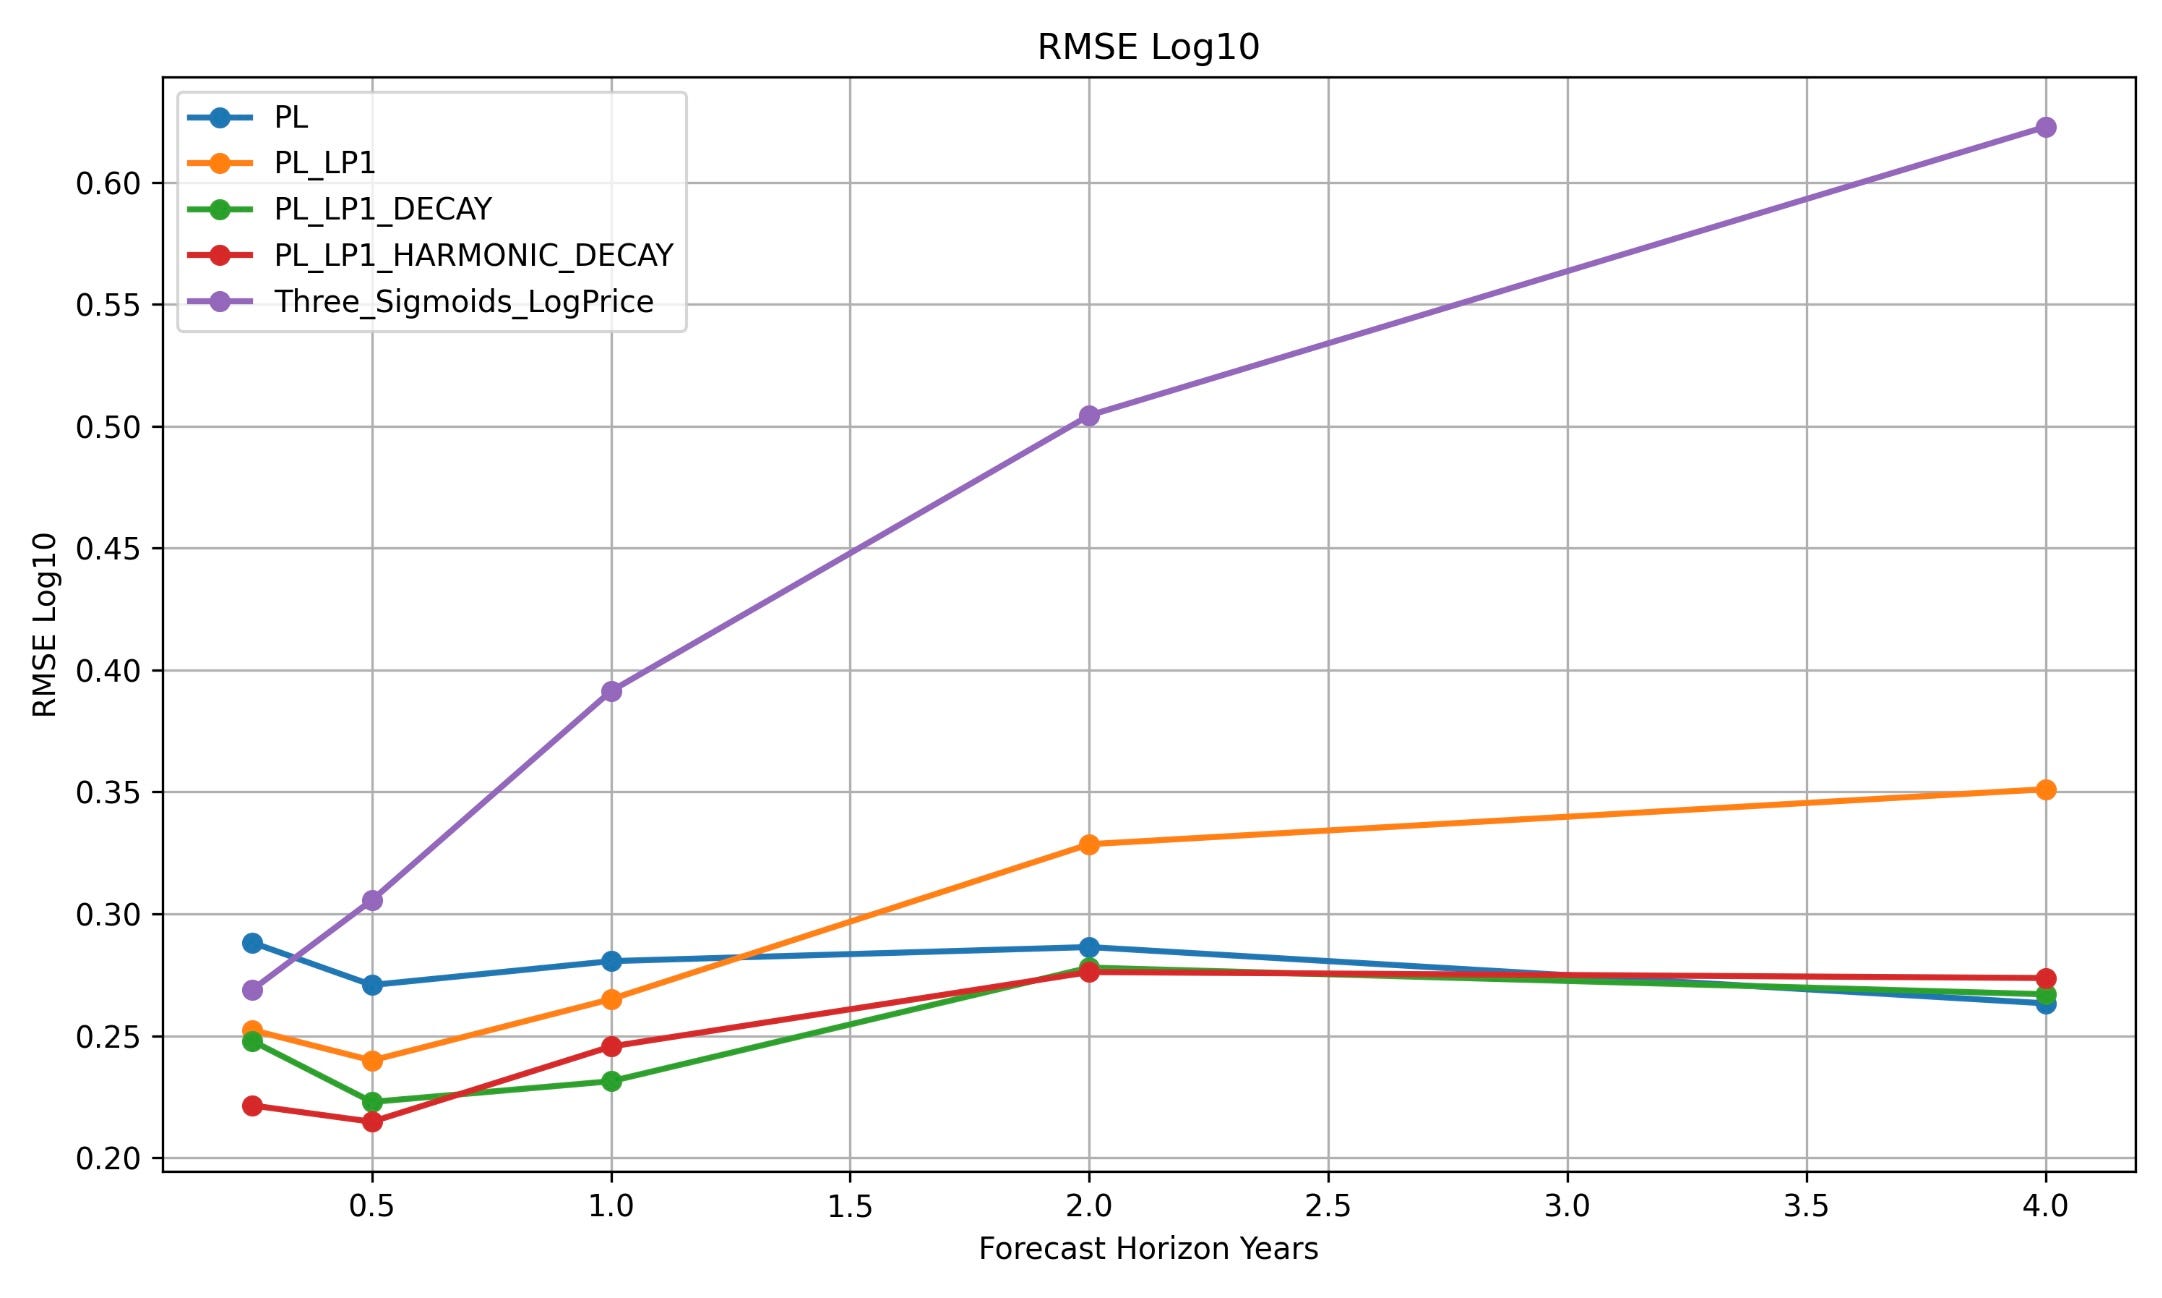
Then I averaged the outcomes for the overall RMSE estimates as shown in Figure 5. I looked at forecast horizons of 3, 6, 12, 24, and 48 months. My results for the power law and three sigmoid models are broadly similar. The sigmoid error (purple) rises very quickly, reaching nearly a multiplicative factor of 2.5 at one year and exceeding a factor of 3 in actual/forecast ratio (0.5 in log10) at the two year horizon. The power law (blue) improves with age. It is also outperformed by a model with only a fundamental log-periodic mode or fundamental and one harmonic (red, green curves) up until a horizon of three years.
Log-periodicity with one or two modes improves forecasting out to a three year horizon relative to a pure power law model that in turn is useful and well behaved.
Conclusion
“All models are wrong, some models are useful”. The three sigmoids model is ad hoc, has no theoretical motivation, and turns out to not be useful for forecasting. The power law model is quite useful, especially at longer time frames, and is directly motivated by Metcalfe’s law and the observed power law seen for adoption. See the Santostasi and Perrenod paper “A Mechanistic Derivation of the Bitcoin Price Power Law” available at https://scientificbitcoininstitute.org/research/publications.
The log-periodic oscillations (DSI) around the power law are a natural adjunct and endogeneous consequence of the continuous scale invariance and response of the Bitcoin network to adoption waves and appear to be useful enhancements to forecasting in intermediate time frames from 1/2 year to 2.5 years.
Spurious oscillatory models can collapse when resampling, changing resolution, and changing spacing. In contrast, here and elsewhere I have demonstrated DSI with a broad range of methods, using both daily and weekly data for Bitcoin denominated both in the US dollar and in gold terms, and found in each case similar values for the log-periodic parameter (and as a result, the fundamental angular frequency). And I have shown here that inclusion of log-periodicity is statistically useful for forecasting over intermediate time frames.
These results materially strengthen the claim that:
* the log-periodic structure is endogenous,
* persistent,
* and scale-related rather than sampling-related.
Baquero and Menezes are correct that Bitcoin contains structure beyond a pure power law. However, the evidence presented here indicates that this structure is not best described by a finite sequence of sigmoid adoption waves. Log-periodic modes provide a superior explanation of the residual behavior, achieve better information criteria with fewer parameters, and improve walk-forward forecasting. The evidence therefore favors a Bitcoin model exhibiting both continuous and discrete scale invariance rather than one governed by a series of unrelated logistic adoption events.
The important point is not merely that sigmoid models fail at forecasting. The deeper result is that Bitcoin appears to possess a reproducible hierarchy of scales. The power law captures the continuous scale invariance of the network, while the log-periodic modes capture discrete scale invariance. Together they explain both the long-term growth and a substantial fraction of the oscillatory behavior around that growth. The same characteristic spacing parameter, λ ≈ 2, emerges repeatedly across Bitcoin denominated in dollars and gold, across daily and weekly data, and across multiple independent analytical methods.
Stephen Perrenod engages in econophysics research as a founder and Associate Director of the Scientific Bitcoin Institute (.org).