Bitcoin’s Four Block Year Cycle
not the Presidential four year cycle
You may have seen yearly candlestick charts for Bitcoin’s long term price history. The chart above is a little different, in that it is exactly synchronized to the Halving schedule, since it uses Block years.
Each of the block years is 52,500 blocks in duration. In the early years of Bitcoin there was substantial difference between calendar years and block years, now the lengths are much closer to one another but the start dates for a block year and a calendar year are quite different. Currently we are in the 15th block year, and just over halfway through it, so the last candle is the current partial one with a half year of data.
Lately, block years have been starting in May, not in January as originally. This is a result of the average block over Bitcoin’s history running almost 5% faster than the 10 minute nominal length. The precise length depends on hash rate deployed by miners at each block and the difficulty adjustments that occur with each 2016 blocks.
In May 2023 or late April 2023 we will enter the 16th block year, the final block year before the fourth Halving event in April or May 2024. The Bitcoin calendar is running 8 months faster over its lifetime than is the Gregorian calendar.
I determine the open, high, low, and close from block monthly prices (each 4375 blocks). The prices in the first two block years are from the Liberty exchange PayPal transfer in late 2009 and the famous Pizza exchange in 2010.
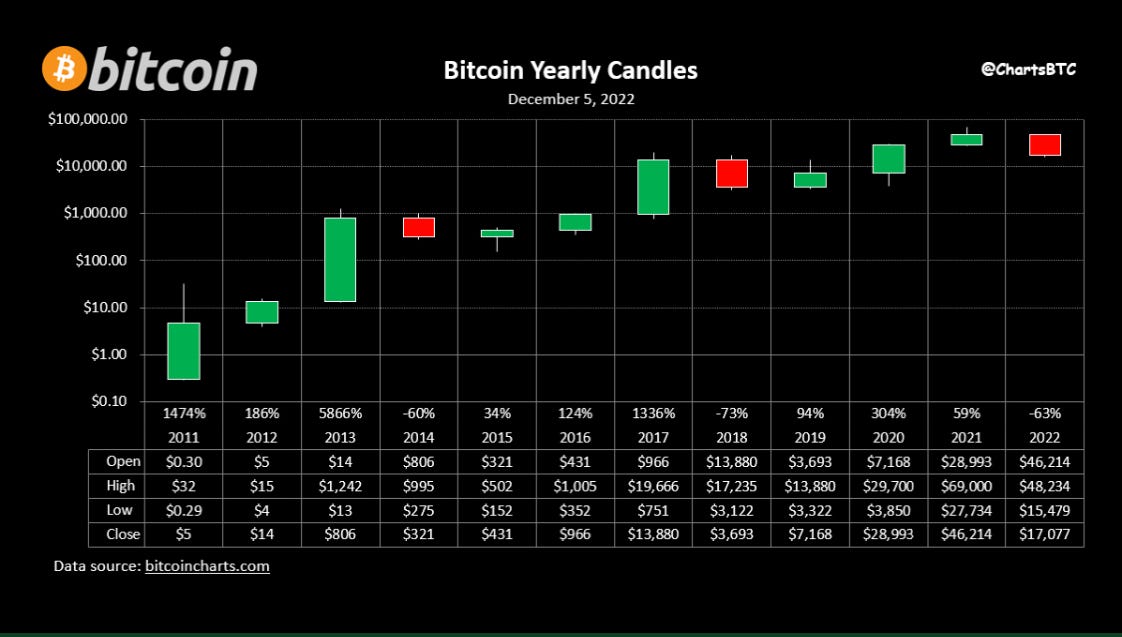
And below is the usual type of yearly candle chart you see — this nice chart (black background) is from @ChartsBTC. It uses daily prices for highs and lows so the bars can be a bit larger in some cases. Both this chart and the block year style chart are displayed in logarithmic fashion (log base 10 of US$ price). This chart does not include the first two years of data before real market-based price discovery and thus has 12 data points rather than 15, since the block calendar is running faster than the regular calendar.
In both charts we can see the evidence for the four year cyclicality. In the block calendar version the Halvings occur at the beginning of the 5th bar, the 9th bar, and the 13th bar. There is some tendency for the 4th year of the cycle and the 1st year of the new cycle to be good years, and the other two years are weak years. One can find exceptions, but the strongest block years have been 5, 9, 13, the first year of each cycle.
In the black background chart based on regular calendar years, 2013, 2017, and 2020 are the strongest. The last three Halvings were in November 2012, May 2016, and May 2020 so the first block year strength is spread over a couple of candles, especially for the last two cycles.
In the block calendar chart the current crypto winter spans two candles, and is more clearly seen to be a serious downturn in price and time as compared to prior down markets.
The Bitcoin block yearly candle chart shows:
Bitcoin is rising in price long-term
Bitcoin is rising more slowly in price as time goes on, consistent with a power law of block height model or an S-curve model such as my Weibull function model
Volatility is high but is decreasing with time (of order 0.3 in log price terms, or a factor of 2, for 1σ)
Upside candles can be larger, the skew is in our favor
First years of a Halving cycle are the strongest (5, 9, 13)
Third years of a cycle are weak (7, 11, 15 [current year])
By May 2023 we will enter the last year of the current cycle, those have all been up years (4, 8, 12)
This Bitcoin winter could end around April or May 2023, depending on the macro backdrop
I see a dragon, especially in the first chart, do you?
Of course the macroeconomic backdrop also matters, and there is a high probability (35% according to Goldman Sachs economists in November, 65% according to their CEO this week) that we are entering a global recession in 2023. When it will start and how long and how deep are of course unknowns.
Tight liquidity policies by central banks are pushing the global economy toward recession and are headwinds for risk assets including Bitcoin. If we are clearly in recession by the spring that should stop their tightening at the margin, and perhaps the Fed and other central banks will begin to loosen.
Bitcoin is not appropriate for speculation by non-professionals. Most investors can’t handle the volatility. It is most appropriate for low-time preference, long time horizon, patient savers and investors.
The foregoing is not investment advice. Manage your risk according to your circumstances.


