Bitcoin power law vs. Gold mid-2024
Log chart demonstrating power law behavior of Bitcoin priced in gold ounces, since the beginning of 2011. The time axis is in calendar years - 2009 and bitcoin has climbed 5 orders of magnitude; it is approaching one kilogram of AU per BTC. Power law index 5.47.
This is a log10 chart of Bitcoin measured in gold ounces (log on the price axis, linear on the time-axis). Bitcoin has increased in price from 0.00022 ounces to 27 ounces during the past 13.5 years. The power law index is 5.47 and the fit has an R^2 of 0.94.
(A regression of these same quarterly prices in block years runs from 1.91 to 16.2 block years and has a slightly lower power law index of 5.35, and R^2 0.95).
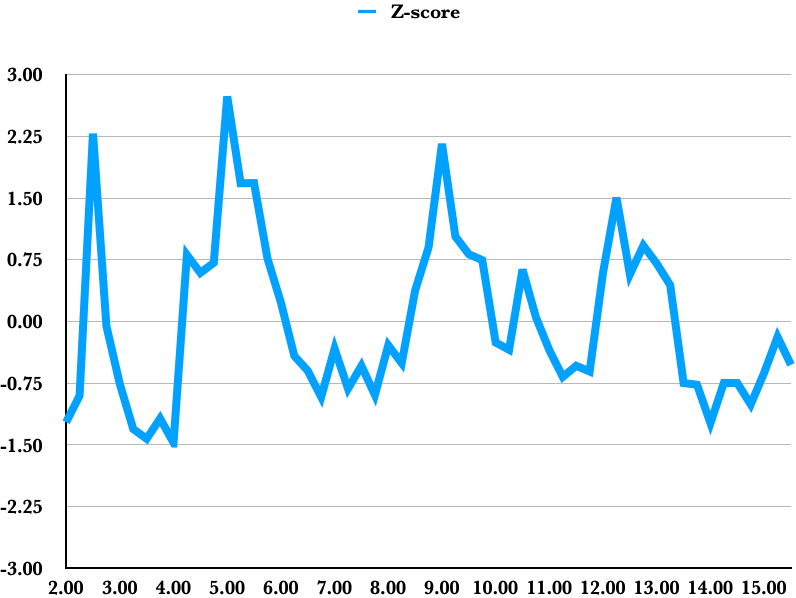
The residuals are positively skewed. The standard deviation is 0.31 in the log10 which is a multiplicative factor of 2.1. The Z-scores have ranged between -1.5 and +2.5 but volatility has been compressing.
Z-scores for differentials from power law fit, normalized to a standard deviation of 0.31 (multiplicative factor of 2.1).
Right now we are well below the model trend, which is at 40 gold ounces, right around $100,000. As global liquidity is trending up now, the expectation is that the boost to Bitcoin price will be a significant multiple of the boost to the gold price and the gap can close.
One can extrapolate the main trend forward in time using:
Price of BTC = 40 *(t/15.5)^5.47 ounces of gold,
and thus mid-year 2025 on trend (t = 16.
5) would be in the neighborhood of 56 ounces. This is apart from any major bubble that could occur and take the Z score above +1 representing another factor of over two.
So, if the trend holds and gold went to say $3000 and there was a bubble to Z of 1.0, 56 x 3000 x 2.1 could surpass $300K next year. The downside for a year from now should be around 20 ounces and if gold was unchanged, that is about $50K.
Modest downside, lots of upside, Bitcoin's power law and convexity are your friends.


Hi Stephen,
I read your BTC vs Gold power law article. Great stuff! Thanks for sharing your knowledge 🙏🏼
Could I ask you something in regard to the article? I'm trying to run the numbers myself. I've replicated the model, but I have trouble calculating the negative standard deviation. +1 is a factor of 2,1. Are you willing to share what the -1 value is? If I divide the mean by 2,1 I get 26 ounces in june 2025 and you are talking about 20 ounces.
Appreciate it!
Best regards,
Johan