Bitcoin Bubbles and Crashes collectively behave as Power Law
True for minor bubbles as well as the major ones

Mini-Bubbles
Minor bubbles (mini-bubbles) can be selected over shorter time frames without considering the power law nature directly. However, somewhat incredibly (but not surprising on deeper reflection) it is implicitly emergent, as I will show below. In Figure 1 there are 31 mini-bubbles displayed by vertical bands and meeting the criteria of velocity greater than 0.003 in log10 daily price increase, and persisting for 15 or more days. The minimum bubble with these criteria yields an 11% increase in price.
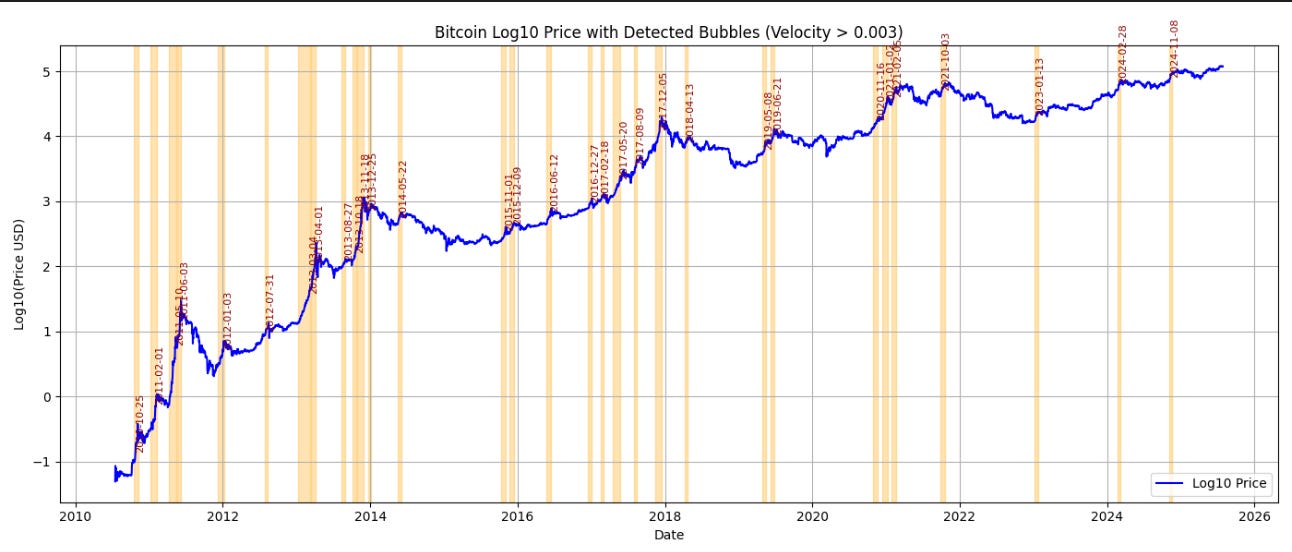
This filter found 31 mini-bubbles, 2/3 of which occurred prior to 2018. Note the clustering, as many of these define the substructure of the major bubbles of 2011, 2013, 2017, and to a lesser degree, 2021. The rate of occurrence has fallen to about one per year with this selection method. This is only the upward bubbles, we will show the anti-mini-bubbles, or small crashes, below.
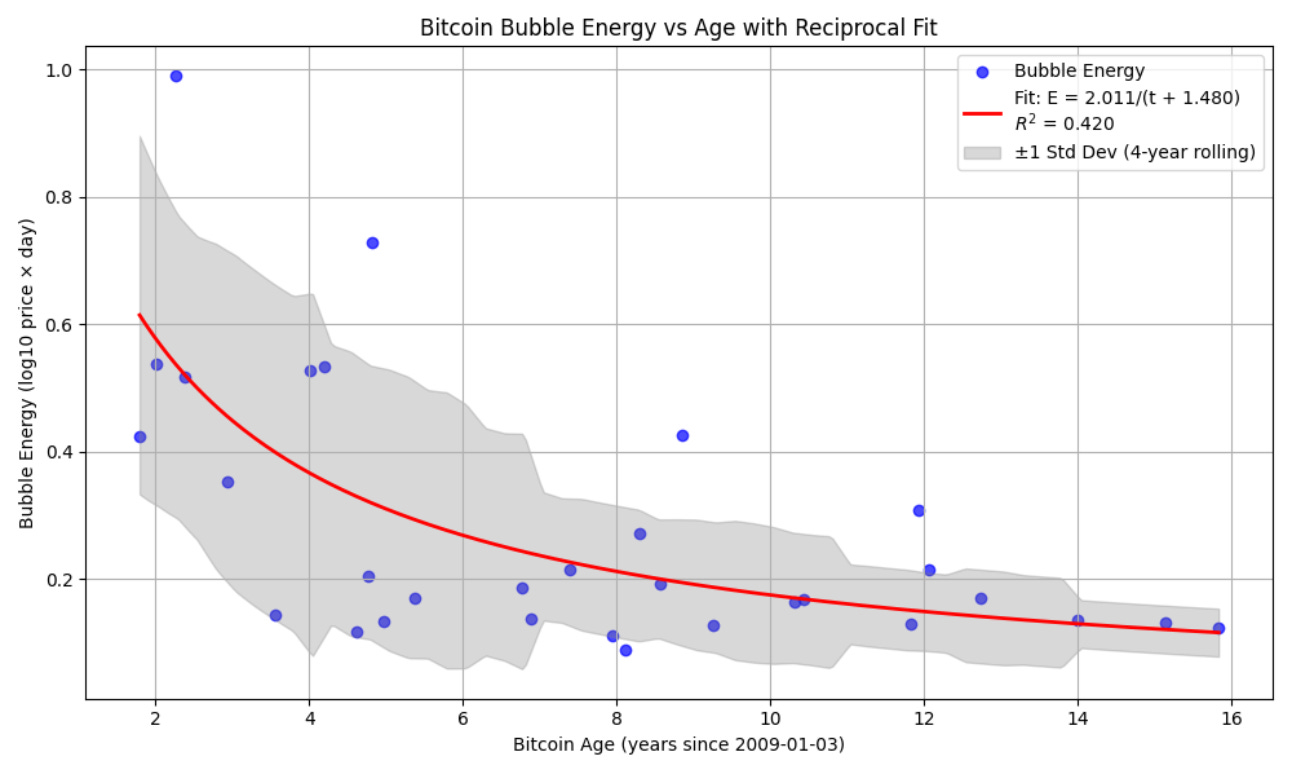
Figure 2 presents the bubble energies as a function of Bitcoin age, with the energy being defined as the sum of the log price changes over the bubble duration. The energy appears to drop by a factor of 3 or more, especially evident in the maximal values, and can be fit by a reciprocal relation with small offset. Note that a bubble energy of 0.5 is sufficient to triple the price (since 10 raised to the 0.5 power is 3) and a bubble energy of 0.3 is sufficient to double the price during its duration. The era of doubling and tripling or more in a single mini-bubble appears to have terminated, however, by the end of 2021.
Anti-Bubbles
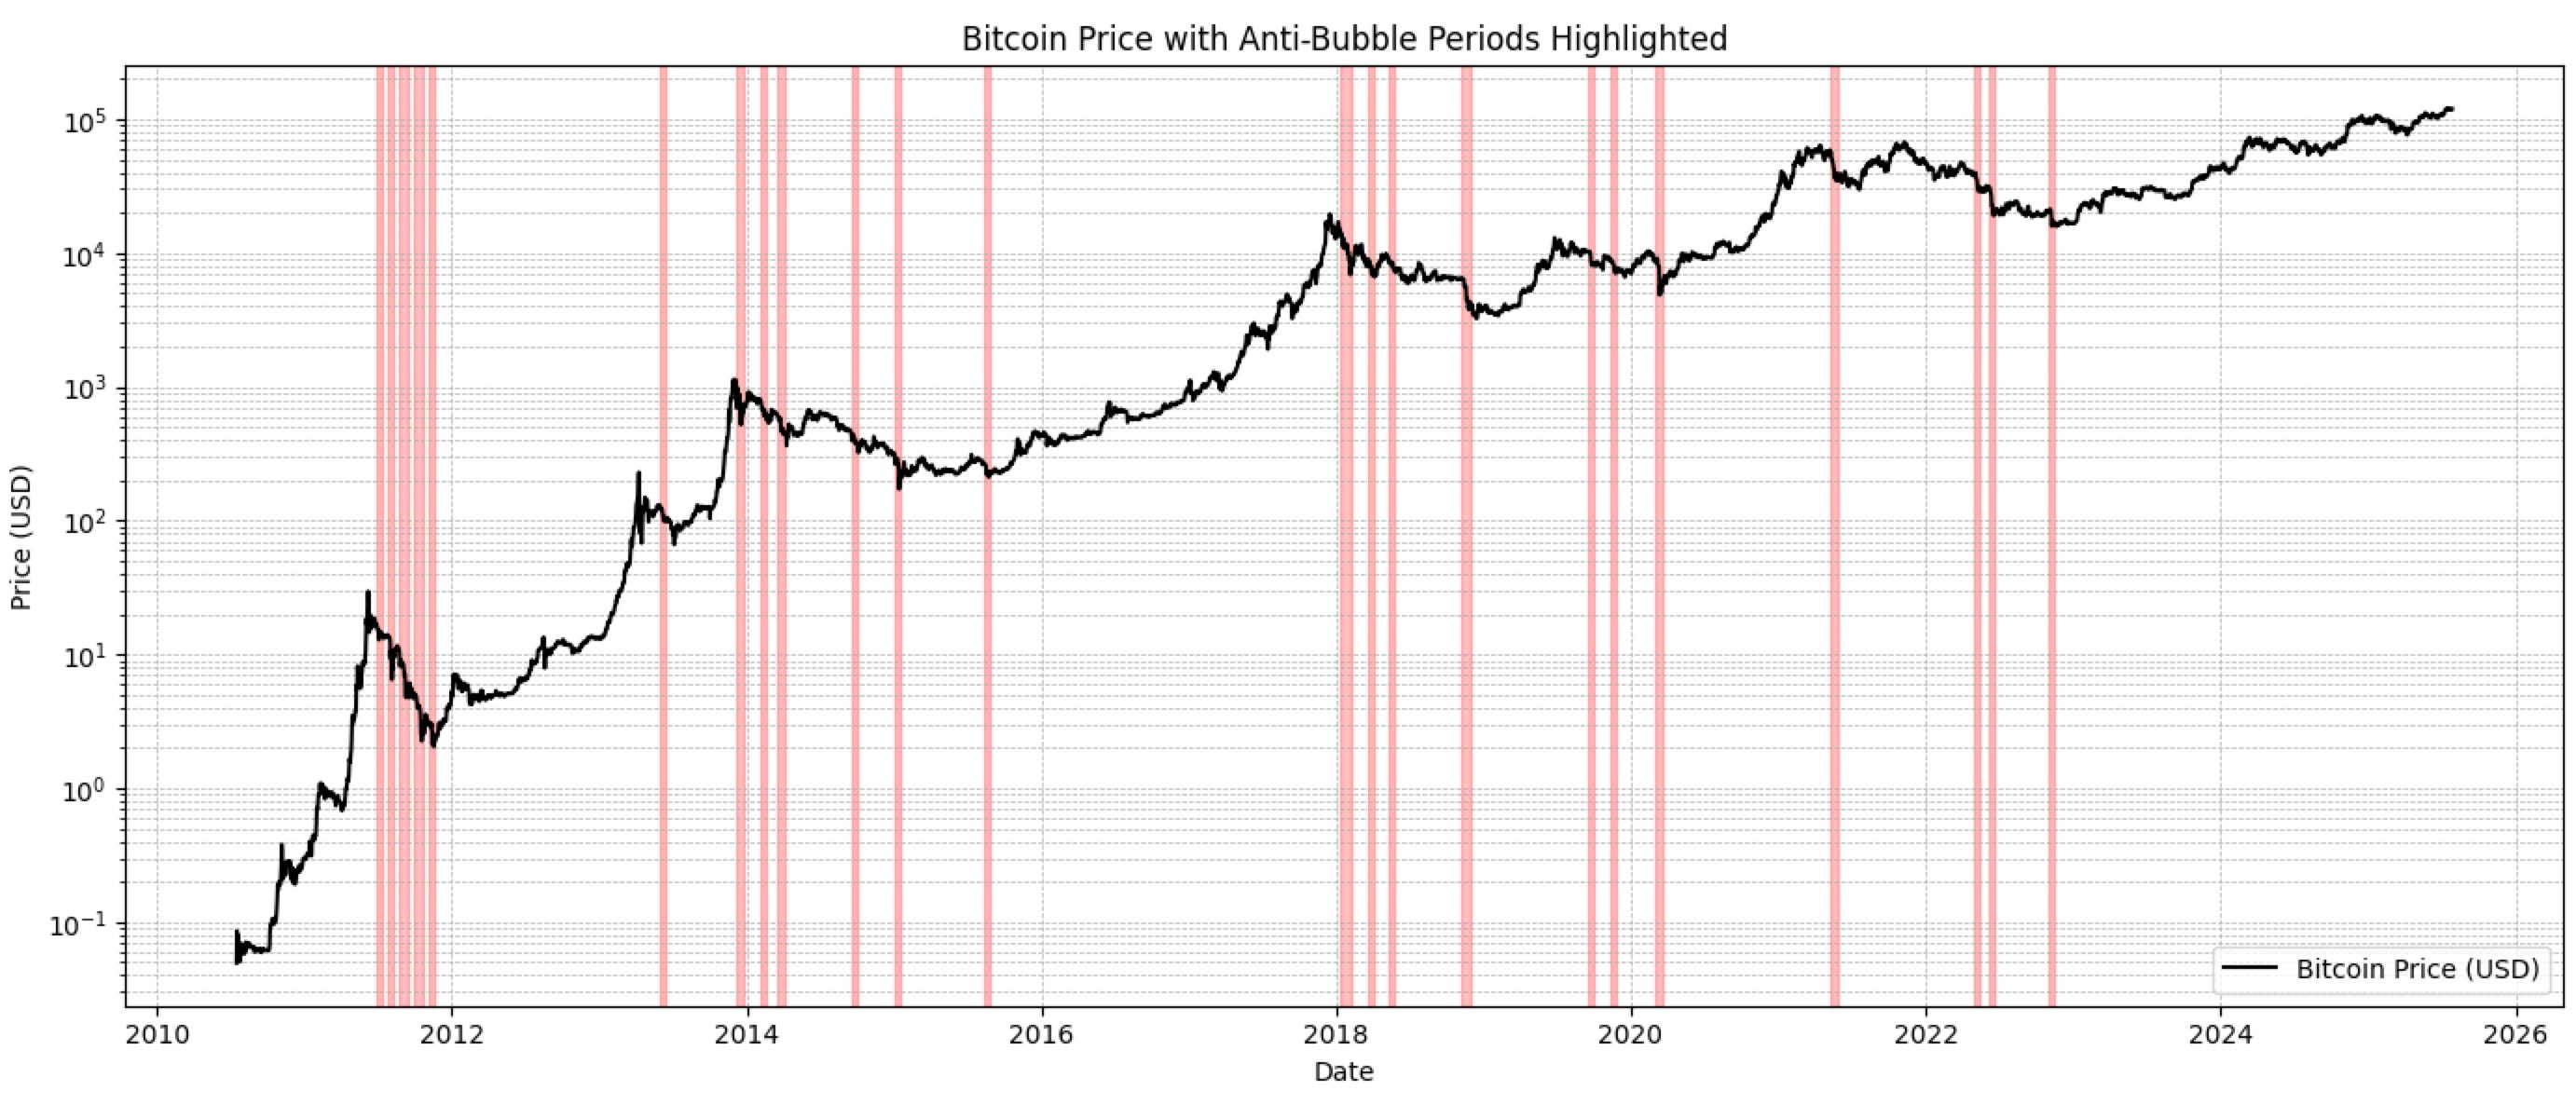
Anti-bubbles can be selected with the same filter, but in the downward direction. Over the same 14 plus year period 23 such small crashes or anti-bubbles were found, and are shown in Figure 3. There have been none since the beginning of 2023, although there is a more balanced number of events in the first half versus second half of the data set. Again we see clustering, especially earlier on with the crashes of 2011, 2014, and 2018, and to a lesser degree the 2022 decline. The crash of 2011 with 5 back to back mini-crashes brought the price down by a factor of over 10, but the 2022 group of three did damage of more like a factor of 2.5.
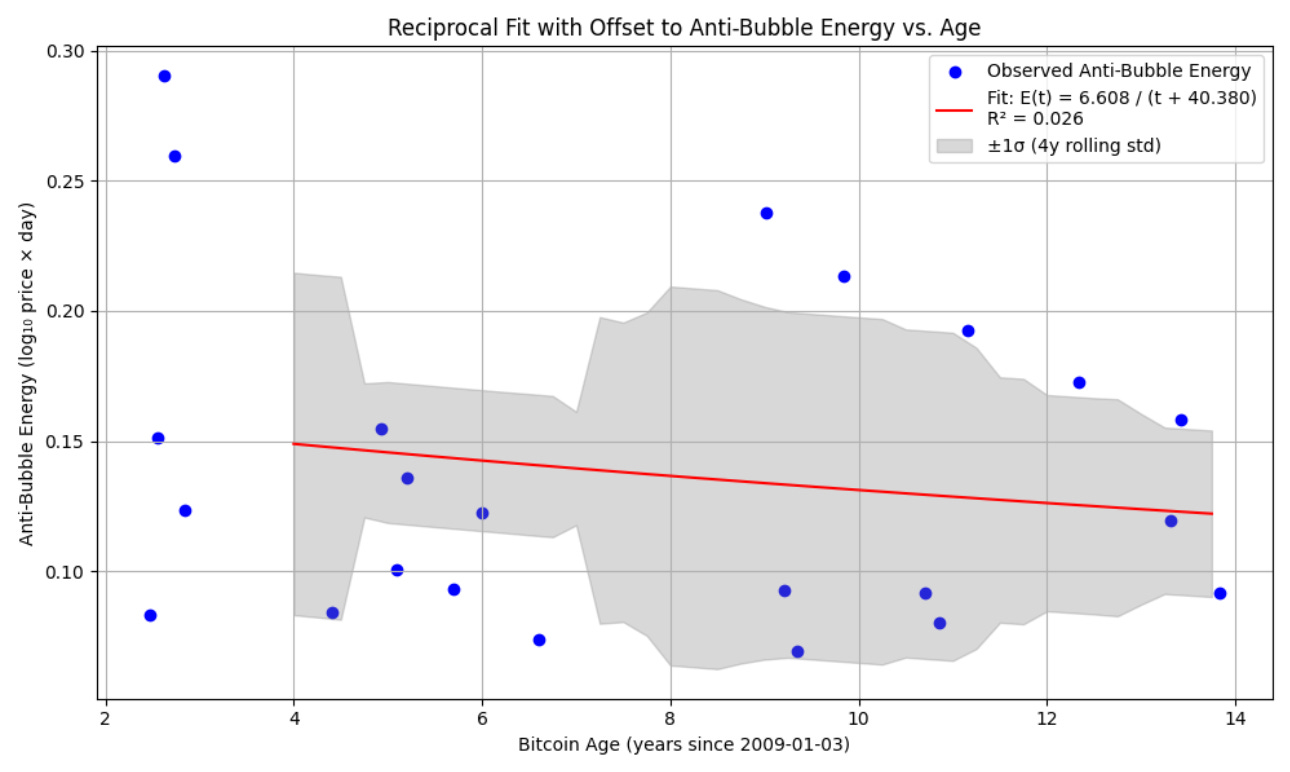
In Figure 4 we show a fit of the anti-bubble energy vs. Bitcoin age. There is only weak evidence for overall decline but the upper boundary appears to have dropped by a factor close to 2. The volatility has dropped perhaps by a factor of over 2 as well, from its peak.
Collective behavior
Now collectively, these 54 mini-bubbles and anti-bubbles took up just 21.5% of the total duration of the data set history, spending about twice as much total time in the mini-bubbles as in the anti-bubbles. I have isolated just the effect of those, ignoring 78.5% of the daily price data to produce this stair step function.
Figure 5 shows how the price would have behaved due to the 54 mini-bubbles and crashes alone, apart from the overall trend, and very interestingly, it still would have increased by 5 orders of magnitude. This occurs since the mini-bubbles outweighed the anti-bubbles in average energy (0.25 vs. 0.15), and in aggregate duration (2:1).
One sees on this log-log chart that the overall nature is roughly a straight line, it can be fit by a power law of index 5.12 with a high
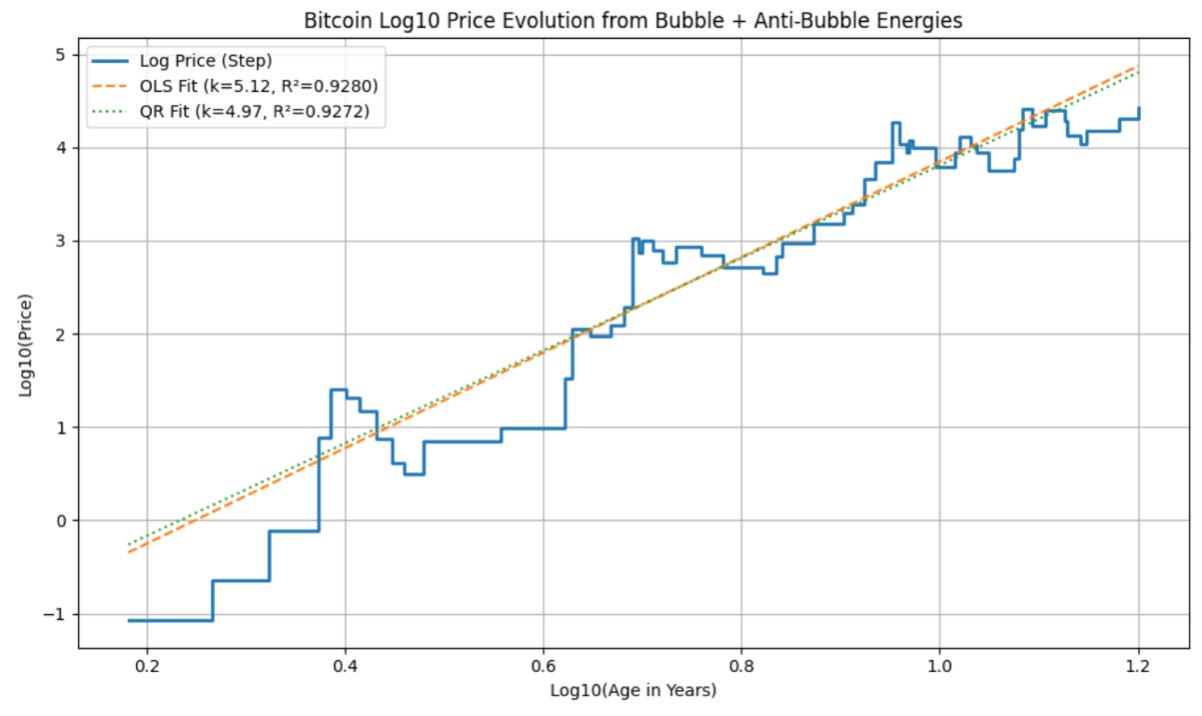
It is quite remarkable that the net path of the series of mini-bubbles and anti-bubbles is a power law of index equal to or greater than 5, and not much lower than the 5.7 index seen for OLS regressions of the full Bitcoin price history. Since this series represents the tops we expect it to be lower, consistent with what is seen in quantile regressions for high levels of say 0.8 (appropriate to around 20% of the overall data series). One of my recent quantile regressions of Bitcoin’s full price history at the level 0.9 had a slope of 5.1 as well.
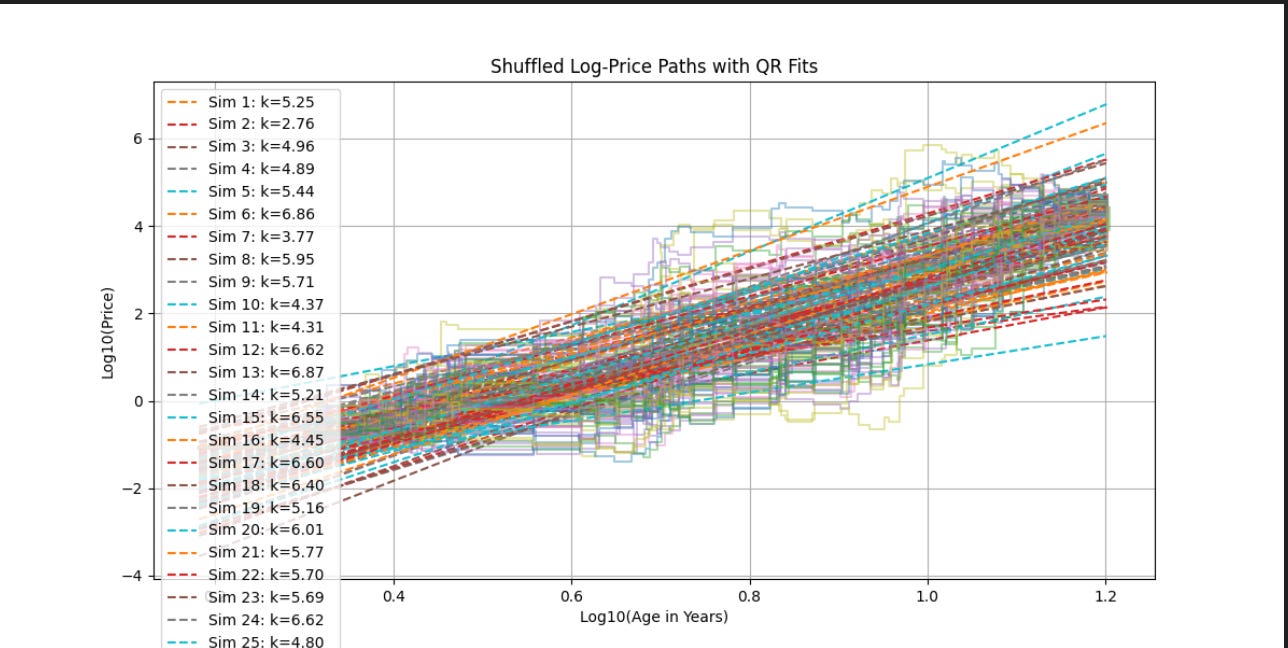
In Figure 6 we present the results of shuffling the sequence of bubbles up and down while preserving their timing. There are 100 simulated outcomes in the figure, and each has been measured for its own power law slope. While there is a broad range of slopes from 2.8 to 8.4, the mean value for the collective behavior is 5.59, with a standard deviation of 1.05.
That is remarkably close to the overall Bitcoin power law regression index of 5.7 using ordinary least squares (OLS). So somehow, the mini-bubbles and the crashes manifest the overall power law nature of Bitcoin.
We expect this, because after each major bubble Bitcoin has reverted to its core power law behavior that characterizes its long term rise. The core power law, resulting from network adoption squared, acts as a price attractor.
Power law aware bubble definition
For long-term analysis it is better to incorporate the fundamental power law trend in analyzing bubbles. It is their movement relative to the power law core that matters, as we have demonstrated with multiple techniques.
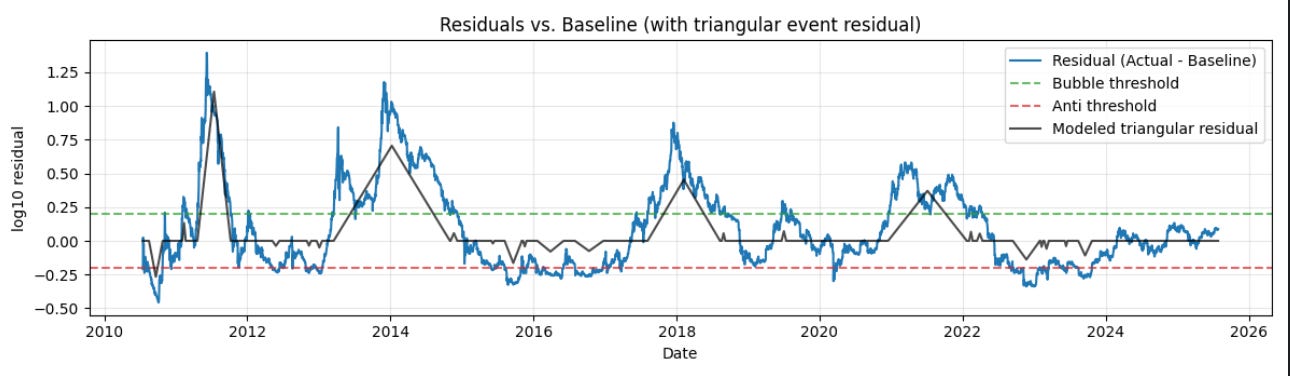
In order to do that we first fit the power law long term trend, one can use either an OLS or QR (quantile regression) method; here I have used the QR median (0.5 level) and computed log price residuals from that long term trend. One then defines a residual threshold, e.g. 0.2 or 0.3 etc. and identified bubbles with a certain duration. I used 10 days as the minimum and if two bubbles were separated by only 3 days from each other they were merged into a single event.
Here’s what it looks like on a log-linear plot with a threshold of 0.2. That is appropriate to the volatility that has been experience during the past four or five years, although the volatility long-term average is more like a 0.3 threshold (one standard deviation).
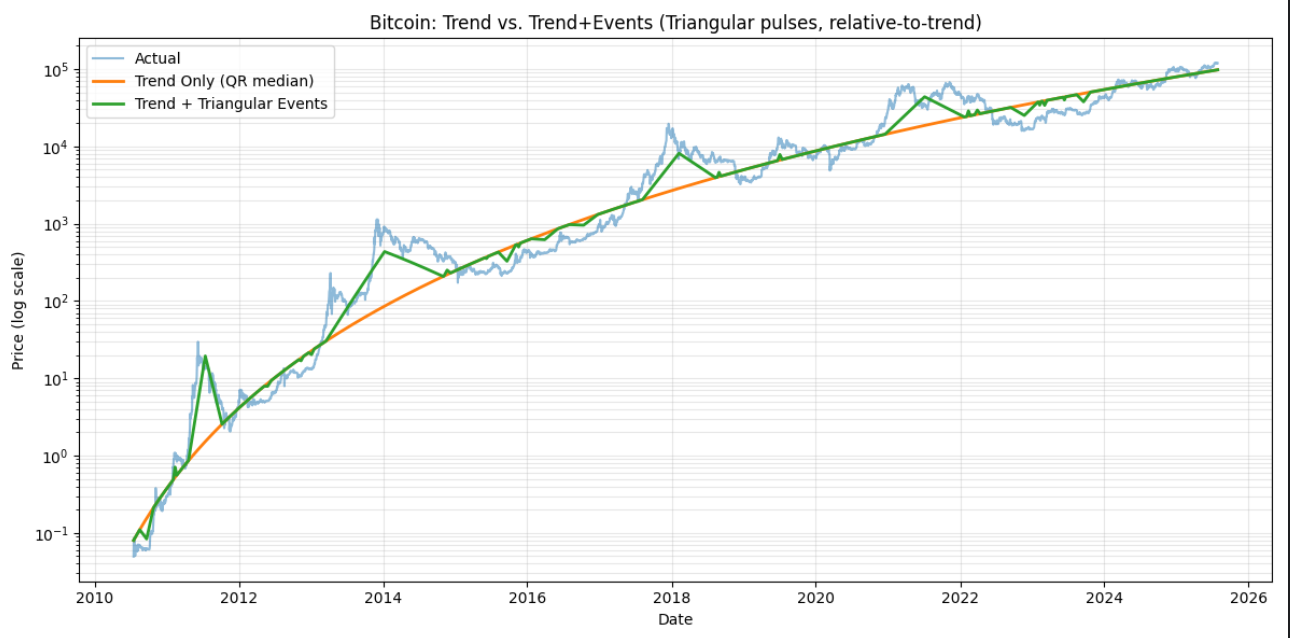
Somewhat surprisingly the number of bubbles varies little with threshold, because as the threshold is lowered, smaller bubbles can merge together. Here we have 10 bubbles and 14 anti-bubbles. The total energy across all bubbles or anti-bubbles is much higher in the bubbles: 467 vs. 44. In fact the mean bubble energy is 47, as large as the sum of all the anti-bubbles.
For these power law residual defined bubbles, the duration is longer, and the number is smaller, than one finds with the method that ignores the power law trend.
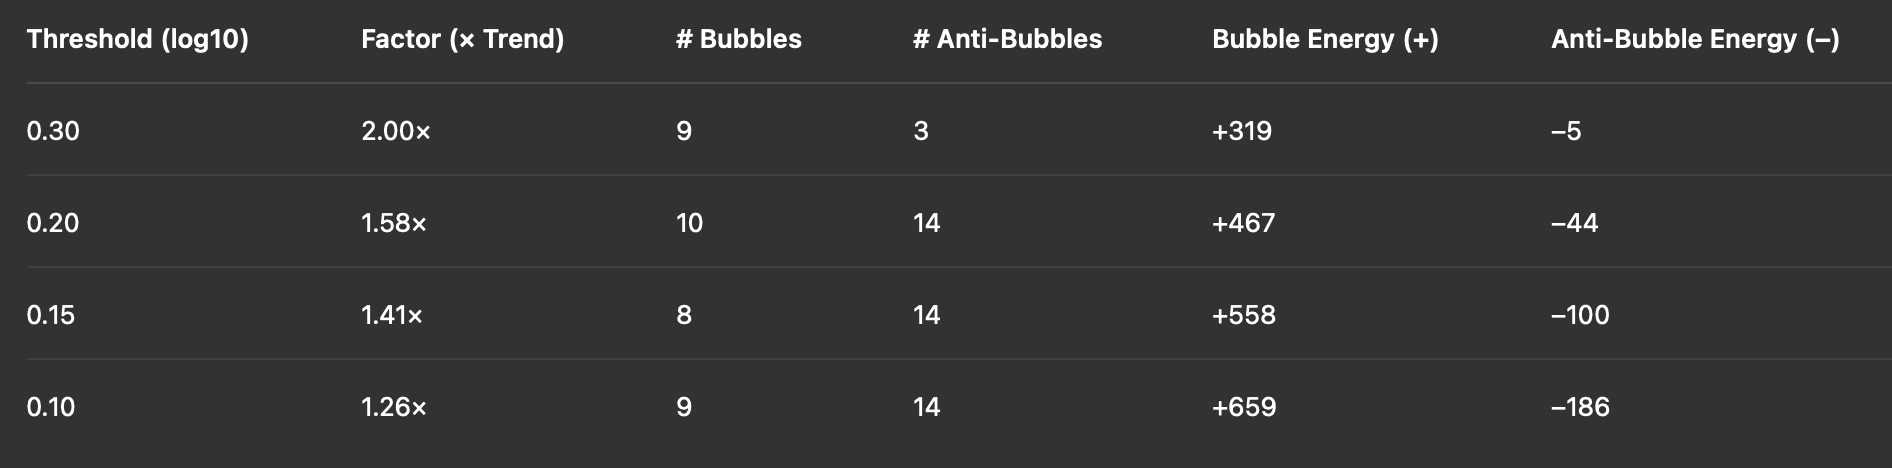
The Table 1 shows how the number of bubbles changes as the threshold is lowered, and how the aggregate energy increases. The number of bubbles is roughly constant due to the merging phenomenon, while the average energy per bubble of course rises, from about 35 to about 73. The overall bubble energy is much higher, even at the lowest threshold it remains over 3 times larger than that in anti-bubbles.
In the case of the anti-bubbles, there are only 3 at the highest 0.3 threshold but then it quickly rises to 14 in number and remains flat as the threshold is lowered toward 0.1. The average energy rises from just about 2 to about 13.
Where are we now?
There has been no bubble of this second type meeting the 0.2 threshold except for two very minor ones at the beginning of 2022. That is somewhat less than the prior cycle’s average volatility (0.24 single standard deviation). There were 5 anti-bubbles in 2022 and 2023. While we are approaching the threshold it has yet to be surpassed. In linear terms 0.2 corresponds to a factor of 1.58 and the QR median trend value is about $94,000 at present. A significant bubble would require us to reach $149,000 for Bitcoin.
We do have an upward trend since the beginning of 2023 and the liquidity outlook is favorable. But bubbles of large intensity driven or initiated by the halving cycle (as opposed to global liquidity and herding) do not look to be our current environment.
Thank you for this. If anything, it answers the question, is there evidence that we are in a stable Bitcoin trading range right now? The answer is clearly yes we are, and there is no inherent reason to expect a major draw down any time soon, though one could always come for unforeseen reasons (government actions, fraudulent actors, exchange hacks).
It is often argued that bubbles are essential to onboarding new bitcoiners, as the FOMO nature of bubbles attracts retail. I have heard Giovanni make this argument. But I don't buy it. Bubbles also create huge draw downs, and without them we may see even more adoption as retail sees there hasn't been a 70-80% crash for years. In other words, lack of crash history could be as or more important to retail as the FOMO bubbles that bring them in.
I also don't buy the halving story as a bubble-driver. It could be a contributing factor, but it just so happens global liquidity cycles coincided with past Bitcoin halving cycles. Small sample size either way but Austrian economic theory is grounded the idea that credit cycles create sustained asset bubbles and crashes. It feels like this halving cycle is reinforcing that idea, as we are now 16 months past the halving and, as you point out, no bubble in sight. Meanwhile, we have had the most anti-inflationary Fed regime since the early 1980's (albeit that is a low bar).
Perhaps we'll see a grind upward from here that persists past the four year cycle, until liquidity causes a bidding up of prices and creates the next bitcoin FOMO bubble. It will be interesting to watch for sure.