
Log Periodic Power Law for bubbles
Dider Sornette is a French geophysicist whose thesis and subsequent work focused on critical phenomena in earthquake forecasts. He has studied earthquakes as critical transitions and developed a mathematical model of power law dynamics decorated with log-periodic oscillations to predict fault rupture dynamics.
For over 20 years he has applied this Log Periodic Power Law (LPPL) model in other domains also, including materials engineering, neuroscience, and in particular financial time series modeling for bubbles and crashes.

Sornette’s 2003 book Why Stock Markets Crash lays out the model’s foundational arguments and provides many examples of its application in stock markets and in forex markets.
Please understand that the Log Periodic Power Law model (LPPL) is quite distinct from the core power law model for Bitcoin’s long-term trend. It is applicable to the bubble zones, not for the overall trend. We have shown that Bitcoin has distinct bimodality: a core long-term power law with intermediate term bubble dynamics, with several prior bubbles spaced around four years apart. Giovanni Santostasi and I have shown that the bubble strength is decaying as a power law of Bitcoin’s age.
What the model seeks to do is to determine how rapidly bubble oscillations are occurring, and when will a bubble burst.
Log time
The concept of things occurring on a log time schedule is well-established. Some of the domains where log time or log periodic behavior can apply are evolutionary transitions, brain sensory processing, shell and snowflake spirals, and financial bubbles. Often the intervals are getting shorter and shorter as one approaches a critical point.
We are all familiar with the decibel logarithmic auditory scale. Sound at 80 db is 10 times louder than at 70 db, and 90 db is 100 times louder than 70 db. There is a similar scale for human visual perception, the Stevens power law, that says perceived brightness grows as the cube root of the luminance.
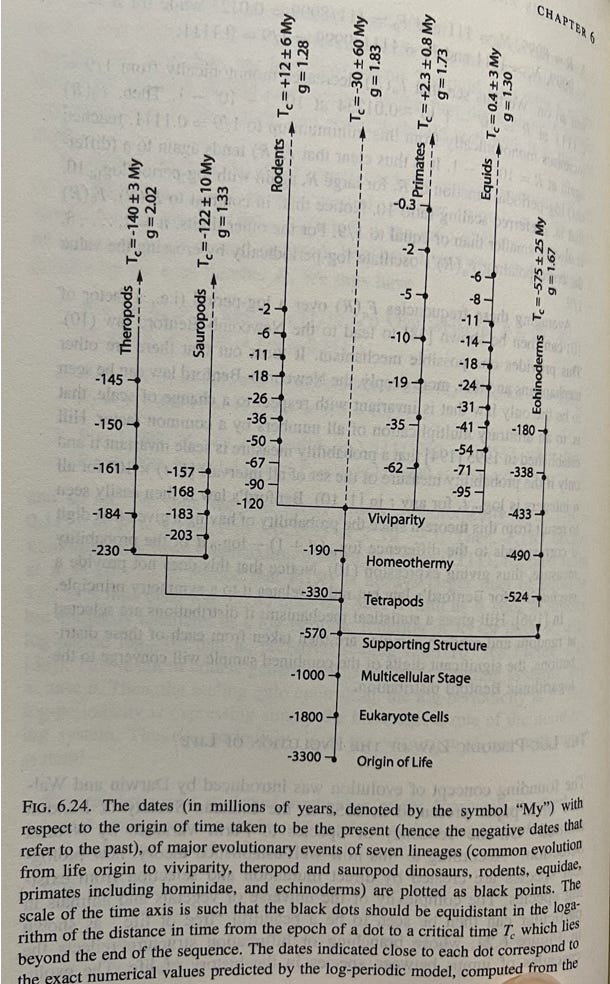
Sornette notes in his book that there is a fascinating logarithmic time dependence for major events in animal biological evolution, with an increasing pace toward critical times that could market extinction or a serious transition. In Figure 1, if we look at the very bottom, the difference between the earliest events is 1500 million years, but the subsequent interval just above that is just 800 million years, and the interval following that 430 million years. The decrease is a ratio of about g = 1.83 for each duration.
The shorter intervals continue until logarithmic time ‘runs out’ and there is a critical event. For the theropods (a certain class of dinosaurs) the critical time was 140 million years ago. For rodents, unsurprisingly, it is 12 million years in the future. The estimate for primates is 2.3 million years ahead.
LPPL equation
The LPPL equation, shown above, is rather intimidating. However in this article we are simply focusing on two parameters found in the square brackets at the end, the oscillation frequency ω and the critical time tc. Note that one evaluates time as the remaining time from now until the future critical event at tc.
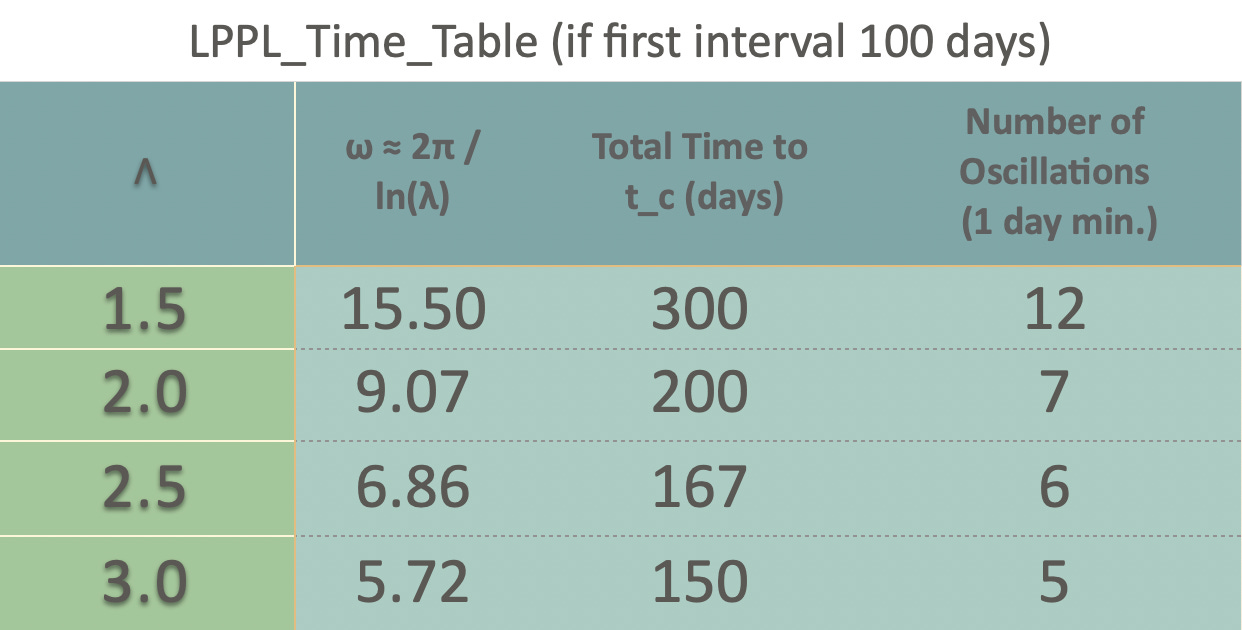
Let’s look at the (angular) frequency first, because this has a relation to the g from Figure 1. In terms of LPPL models this is usually referred to as λ rather than g, and it has a direct relationship to ω as follows:
λ = exp (2 π / ω )
For example if λ = 2 then the time between the second and third oscillation peaks is half of the time between the first and second peak. Table 1 shows the relation between λ and ω, and also shows the total time if the first interval between oscillations is 100 days. Also shown in the table is the approximate number of oscillations.
Some stock and forex market analyses with LPPL
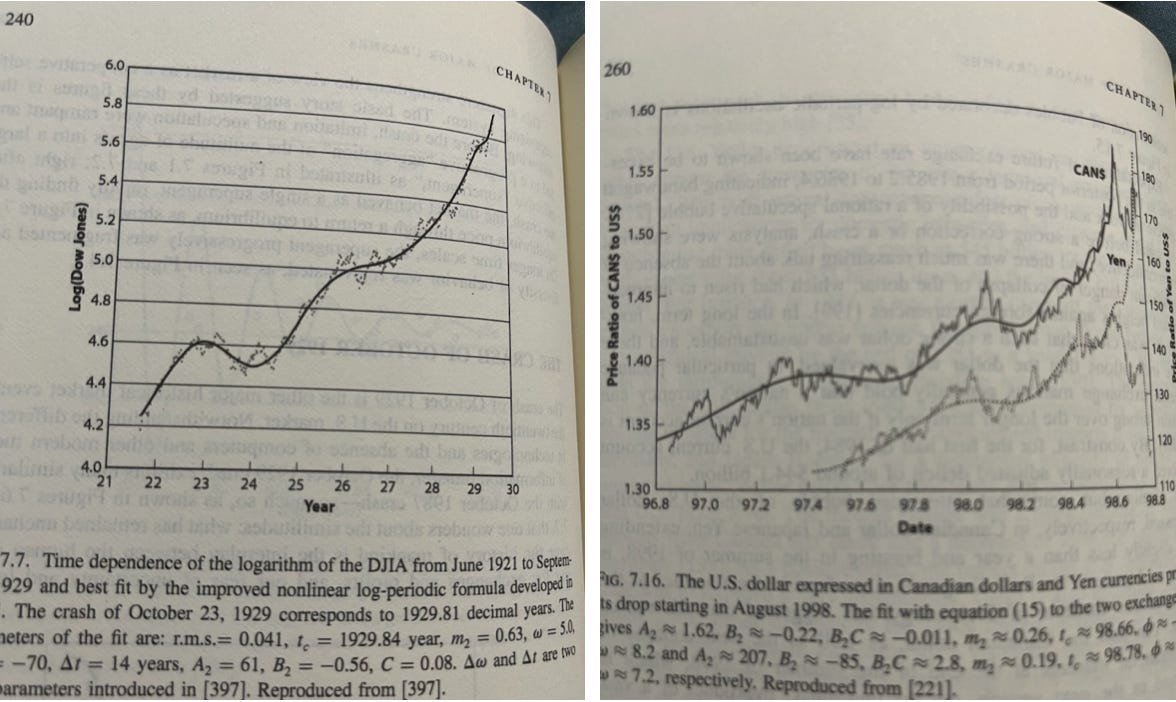
Sornette looks at a number of US and global stock market bubbles and some foreign exchange bubbles through the lens of the LPPL model in chapter 7 of Why Stock Markets Crash. Many can be reasonably fit by the model. Typical values for the frequency parameter ω range from about 5 to about 8 and correspond to λ values ranging from 2.2 to 3.4 across 11 different market analyses.
In Figure 2a we see his application of the LPPL model to the October 1929 market crash, with data spanning most of the 1920s. Figure 2b shows the dollar’s bubble against both the Canadian dollar and the Japanese Yen during the 1997-98 financial crisis. The oscillations were more rapid in this case.
Bitcoin bubbles and LPPL

So what about Bitcoin, can we fit the bubbles with LPPL? The Table 2 above is a summary of the duration of bubbles in terms of number of oscillations (of a day or longer). It includes the early bubble of 2011, and the major bubbles to date of 2013, 2017, and 2021. The number of oscillations has clearly grown from 5 or 6 up to 10 or more. We can fit both the bubble rises and falls with LPPL models, but more clearly for the first three bubbles than recently.
This is consistent with less structure, and with the entropy growth of bubbles spreading out. See my previous article on Bitcoin’s entropy:
What I found is that the 208-week rolling entropy peaks somewhat before the price bubble peaks, falls between bubbles, and also that there has been a general trend of increasing entropy.
This is also consistent with the bubble strength falling more or less as the reciprocal of Bitcoin’s age. The number of oscillations rising and the less structured nature of the bubbles is also consistent with those two observations. “The overall long term rise in the price entropy may reflect maturation of the Bitcoin economy with more classes of participants over time ..” - (from above linked Substack article).
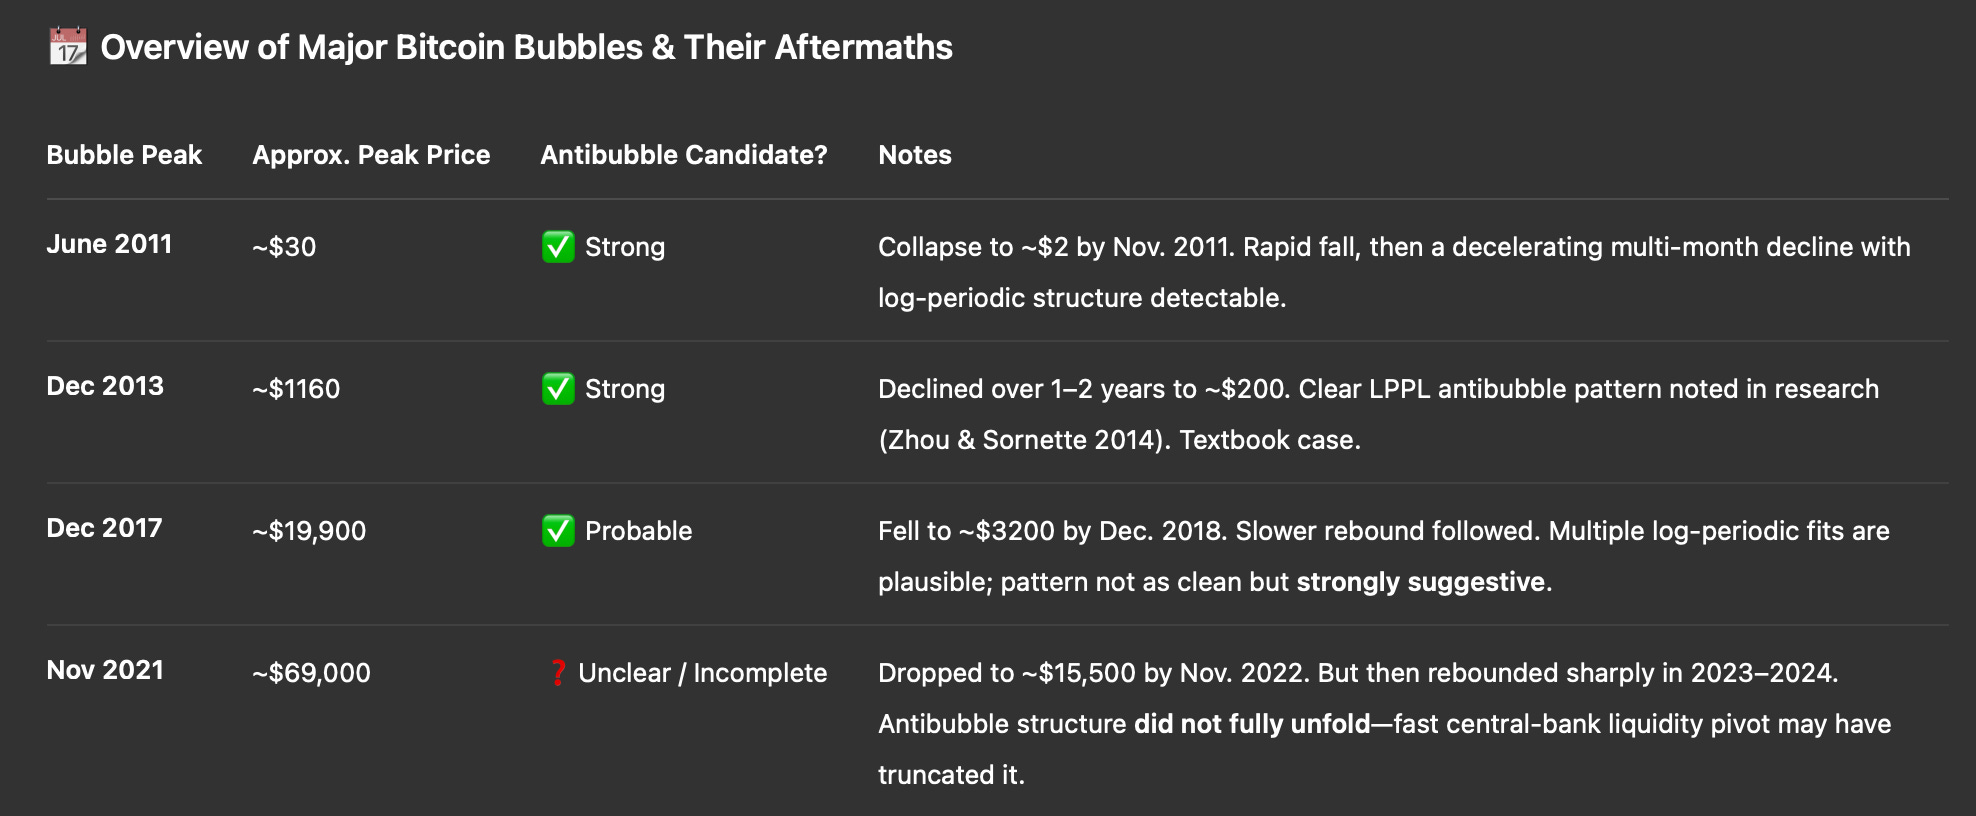
Table 3 is ChatGPT’s take on the anti-bubbles, the crashes of around one year duration following bubbles. The anti-bubbles have become less coherent, less structured with time, consistent with dissipation of bubble behavior seen in the bubble rises.
The following chart is my LPPL fit to the Bitcoin anti-bubble of 2022. This spans the interval (in days on x-axis) from 11/15/21 when the price peaked until the end of 2022 when it bottomed. The fit was against the log residuals of the price relative to the overall power law trend. The \( R^2 \) for this anti-bubble LPPL fit is strong at 0.96, but little of the oscillation structure is captured. The value for ω is 7.5.
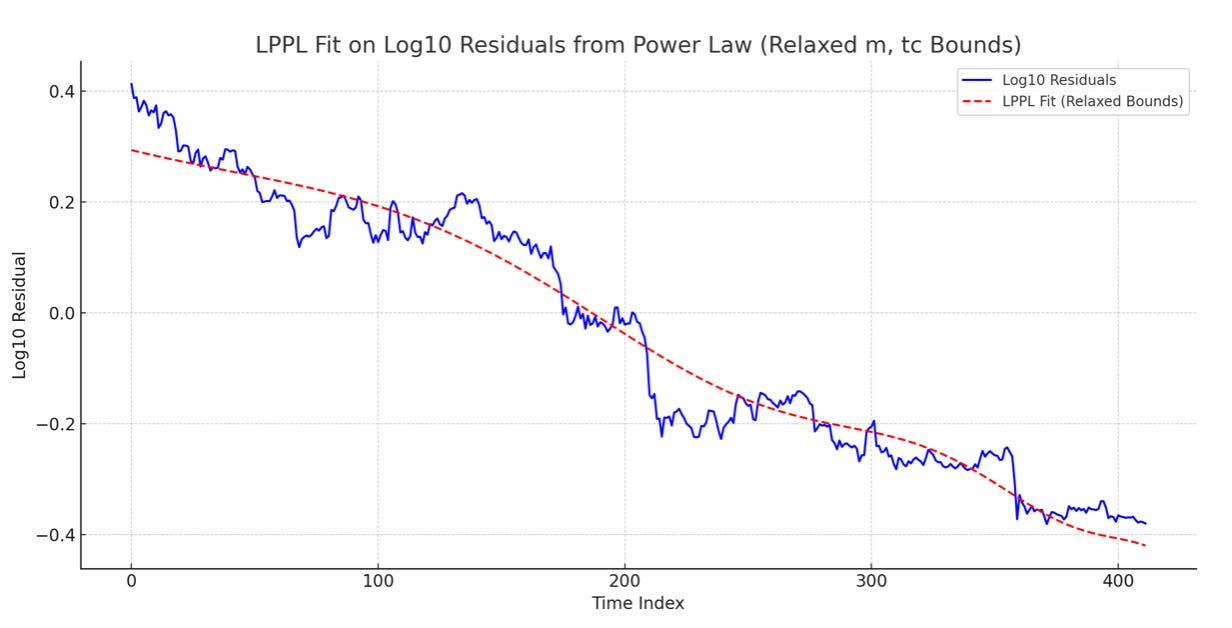
Present-day bubble?
For the behavior of Bitcoin since January 2023 until now, we have determined best fit LPPL models both in log price and price; we want to check the log price as well since the dynamic range is large (over a factor of 7). We get good fits in either case with \( R^2 \) above 0.95 and with ω of 8.5 or 8.0 for the log price and price fits, respectively. In the left hand chart of Figure 4 the natural log of the price is shown (price is recovered by raising e to that value). The oscillatory nature is somewhat better revealed in the right hand chart of linear price vs. calendar date.
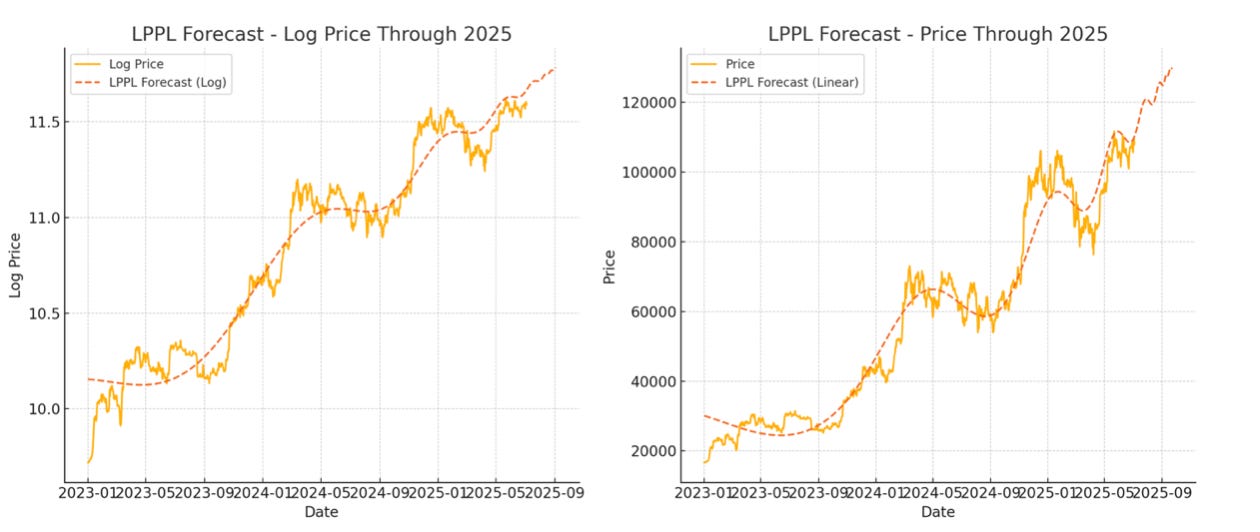
Both fits are currently predicting a critical date or peak in September of this year, specifically around the 23rd for the log price fit and the 3rd for the price regression. But the 7-parameter LPPL fits are sensitive and should be re-evaluated as we get closer to the date and can observe the next oscillation or two. A week prior to the peak the price is predicted at a conservative $129K level.
The next oscillation peaks are predicted to occur around the last week of July and then the last week of August. This can only be considered approximate behavior due to the sensitivity of the 7-parameter model, and the uncertainty grows as we get closer to the critical date (late September).
If bubbles are coming down in strength, and their volatility (entropy) is more spread out, then this behavior is not so surprising. We may not see $200K this year. Do not despair, the power law core growth is carrying us along at faster than 40% per annum currently.
More detail on this analysis is provided in the Physics of Bitcoin #27 show on the Quantonomy YouTube channel.
In my opinion, 2021 didn’t fit the LPPL model because the bubbles were in the dollar and in currencies, not in Bitcoin—Bitcoin should behave like a regular power law if it had gotten its proper place. In 2021 there was an extreme bubble in the dollar, which affected the ability to really measure what happened to Bitcoin… maybe there’s another model that can explain what happened there—that’s your field of expertise, haha.