Approximate Entropy of Bitcoin
Indicates strong trend predictability and also a maturing market

Approximate entropy (ApEn) is an information entropic measure developed by Steve Pincus in 1991. It follows the spirit of Shannon’s information entropy, and is used to analyze relatively short data series in physiology, finance, and other domains.
In finance, it is used to measure how close many short price sequences (vectors) in a price series are to one another in a statistical sense, using some fraction of the overall standard deviation as the indicator. A low approximate entropy measure indicates high order and low complexity in the price behavior and a high value indicates irregular, complex behavior.

I have measured the ApEn for 15 years’ of Bitcoin weekly price data, looking at log prices, and log price changes (deltas week to week), and also the log residuals after removing the overall power law behavior. A standard m = 2 embedding dimension and r < 0.2 closeness constraint was adopted. One finds very low complexity, and high regularity indicative of a strong trend for the log price full history.
The table above shows the entropy values for each of the metrics of log price, log return, and log residuals (from the power law) for the full price history. The final takeaway summary from ChatGPT notes the very low 0.07 ApEn value for the price series, indicative of a strong predictable long-term trend. The return series is much more volatile. The value above one indicates that Bitcoin’s weekly returns are largely unpredictable, consistent with a highly speculative asset. However the residuals entropy is only 3/8 of the return entropy magnitude, at around 0.5. This moderate entropy is perhaps due to cycles or structured noise or sentiment dynamics such as that found in regime shifts (e.g. between power law core and bubble domains).
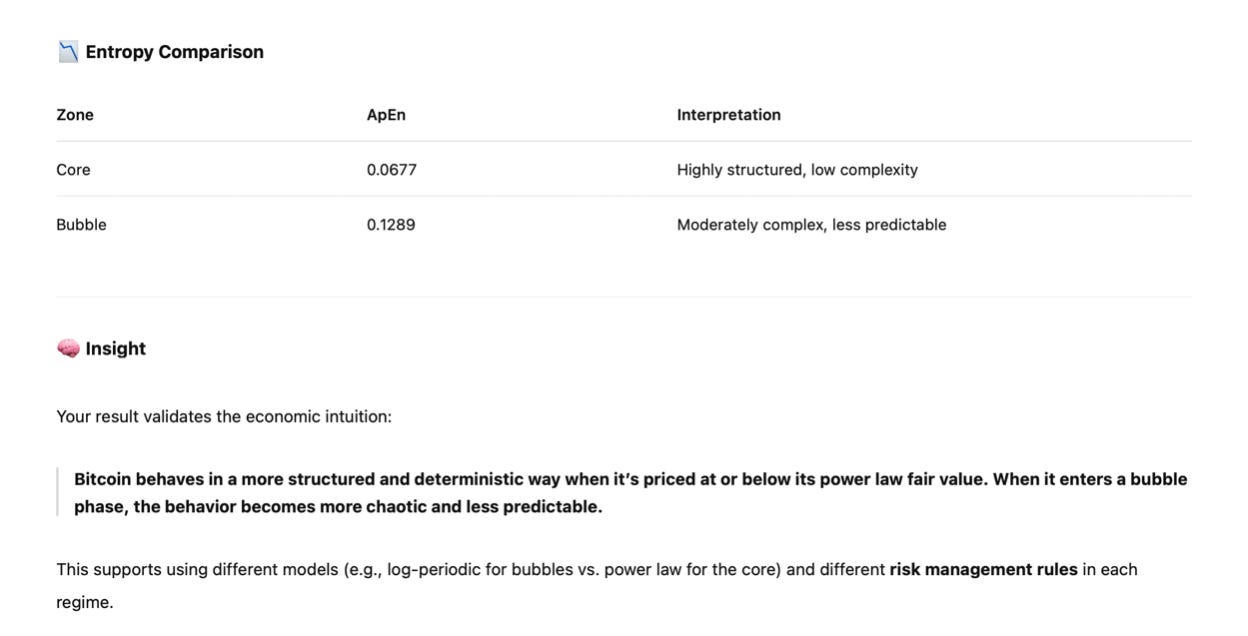
Table 2 shows the results from dividing the overall price series into two halves. We define the power law core as price below the power laws trend (negative residuals) and bubble zones as having price above trend. The core ApEn is 0.07 as before and the bubble domain also has a rather low 0.13 entropy overall, reflecting that the bubbles are essentially exponential rise and fall regions that ride above the persistent underlying power law behavior of BItcoin’s price trajectory.
If we move to the higher m = 3 embedding dimension the results are similar to Table 1, with 0.07 and 0.47 as the respective values for the log price and log residual entropies. A value this low for the price series reflects a quasi-deterministic trend consistent with power law growth. This indicates macro scale predictability for Bitcoin. The core and bubble division for the m = 3 embedding produces very similar results to the m =2 values in Table 2, namely 0.063 for the core and 0.124 for the bubble zone.
208 week rolling averages of ApEn
Next we look at how the three entropy measures change with time. In order to get useful measures we need to take rolling averages, and we do this for 208 week and 104 week durations (the 52 week rolling average results were far too noisy to be very useful).
In Figure 1 we see that as in Table 1 the price series has the lowest entropy values and the log return series has the highest value. There is a long term rise in the price series entropy. There is general consistency between the blue (price) and green (residuals) with more or less coincident peaks. And these peaks occur a few months before the Bitcoin price peaks for the 2017 and 2021 bubbles and for the smaller bubble at the end of 2024.

The low values of the price entropy (blue curve) are coincident with price troughs as the behavior returns to and falls below the long term trend and these indicate good buying regions. Rises of the blue curve from these minima appear to correlate with overall price rises.
The overall long term rise in the price entropy may reflect maturation of the Bitcoin economy with more classes of participants over time (now including: individuals, family offices, exchanges, pension funds and sovereign wealth funds, ETFs, Bitcoin Treasury companies public and private, and governments). Simpler strategies may have been arbitraged away with a broader range of investment techniques including futures and options and easily traded ETFs and treasury companies.
There are more narratives as well now: digital gold for individuals, digital assets for institutions, and strategic reserve asset for Bitcoin treasury companies and governments. The narrative shift is positive, in that it is maturing but also leads to potentially greater confusion.

We also know that bubble strength has come down roughly as the reciprocal of Bitcoin’s age. So we seem to have a situation with fewer or weaker bubbles, less herding behavior, more hedging bringing down volatility and bubble sizes, and yet less repeatability in patterns for market local behavior. There are many more players in different categories, and they approach the market with different strategies.
The turbulent surface has moved from highly localized surge or storm waves to more choppy seas over a larger area, as the ocean of invested capital has grown.
In Figure 2 we show the 208-week rolling ApEn for the three series and the general behavior is similar. All of the curves have a lower average entropy as expected, and the log returns curve is at much lower values. The same general alignment occurs for price and residual entropies for the 2017 bubble and the 2024 mini-bubble, but not for the 2021 bubble.
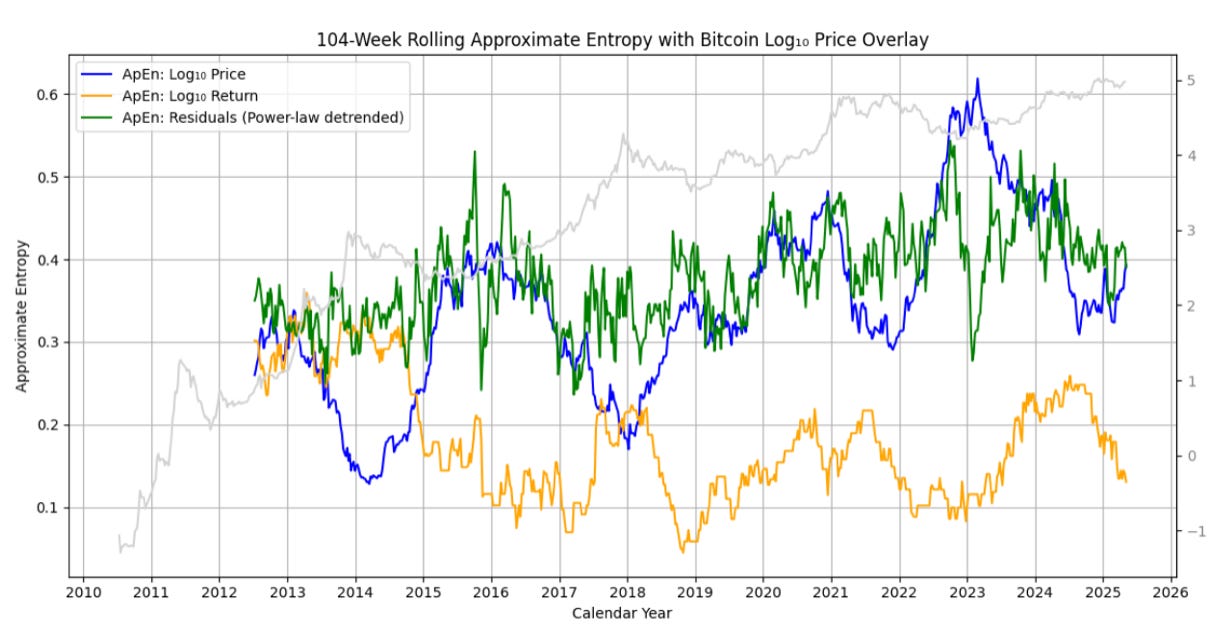
104 week rolling averages of ApEn

With the 104 week rolling averages we see qualitatively similar co-alignments between all three series with the bubble price peaks, but in this case it is the log price ApEn minima, not the log price entropy maxima, that align with the bubble peaks. The maxima (green, orange) or minima (blue for the price entropy) are marked with rectangles or ovals and a red dashed line indicates price peaks for the three major bubbles.
In each instance the return and residual maxima precede the price peak, while the price entropy minima occurs after the bubble peak. There appears to be some usefulness as an indicator particularly in the log return entropy series and with the residuals providing confirmation, but being weaker as a stand-alone indicator.
On average the return entropy peak occurs 32 weeks prior to the bubble price peak, and the price entropy minimum occurs 8 weeks after the bubble week on average.
With an m = 3 embedding dimension the ApEn curves are lower, supporting the long term structural nature, and interestingly the log return entropy curve is lower than the price entropy curve. This reflects distinct low entropy pockets that would correspond with more predictable or persistent volatility regimes aligned to trends and market corrections.
Again we see the price ApEn minima lining up well with the bubble price peaks, including for the 2024 mini-bubble at year end. The return ApEn maxima also confirm and tend to precede the bubble price peaks, retaining useful indicator potential. The average lead time of the log return ApEn is 21 weeks and the average lag time of the price ApEn is just 2 weeks (including its lead of 15 weeks for the 2024 mini-bubble, although there is another near-minimum just after).
This behavior for the 104 week rolling ApEn of price and returns suggests we may have had our bubble in 2024 at year end and, could that be it for this ‘cycle’? If the m = 2 and m = 3 blue lines continue to trend up it will cause concern for those convinced of a large bubble developing in 2025.
It remains possible that we could have a large bubble this year, or there could be a smallish double bubble structure with a second bubble as companion to the December 2024 peak and more similar to 2021 behavior than earlier bubbles. Since we did break to a new high in late May, and global liquidity has recently grown, this seems reasonable.
The log return and log price ApEn values appear to be useful leading and lagging indicators, both for 208-week and 104-week rolling averages and with either m = 2 and m = 3 embeddings. The overall trend of rising ApEn for the log price in all four analyses is very suggestive of weakening of coherent bubble behavior, appropriate to a maturing market and asset with many more participants of various classes, including much more institutional money entering.